Digitalocean Premium AMD vs Intel | WordPress Benchmark Test


Looking to host your WordPress site on Digitalocean’s Premium on an AMD or Intel Droplet?
Then you’ve come to the right place!
Digitalocean introduced premium droplets with AMD’s Zen 2 based Epyc Rome CPUs and Intel’s Cascade Lake CPUs earlier this year.
For those of you who don’t keep up with the CPU architectures, Cascade Lake is another one of those Intel’s refresh of Skylake CPUs from way back in 2015. These chips are still fabricated on the older 14nm Process Node.
While AMD’s Epyc Rome CPUs are based on AMD’s Zen 2 architecture which was launched in 2019. These CPUs are manufactured on TSMC’s 7nm node and have a higher IPC than Cascade Lake.
These new droplets also feature NVMe SSDs.
Even before beginning the test, the winner was obvious to me but the results were unexpected.
I was expecting a decent performance difference but it turned out to be a massive one. It was incomprehensible that Digitalocean is offering both the Premium droplets at the same price even though they have such a stark difference.
So without any further ado, let’s jump into the performance tests.
Test Setup & Methodology
For this test, I have created a total of four droplets on the $6 and $12 plans for both AMD & Intel.
Let us first see how the 4 plans stack up.
| Premium AMD $6 | Premium Intel $6 | Premium AMD $12 | Premium Intel $12 | |
|---|---|---|---|---|
| CPU Cores | 1 | 1 | 1 | 1 |
| Memory | 1 GB | 1 GB | 2 GB | 2 GB |
| Storage | 25 GB NVMe | 25 GB NVMe | 50 GB NVMe | 50 GB NVMe |
| Bandwidth | 1 TB | 1 TB | 2 TB | 2 TB |
All the 4 droplets are deployed on the same location, i.e. SFO3 (San Francisco) running WordPress 5.8 on Ubuntu 20.04.
| Droplet | OS / Droplet Location | WordPress Version | Theme |
|---|---|---|---|
| Premium AMD $6 | Ubuntu 20.04 / SFO3 | 5.8 | Generatepress 3.0.4 |
| Premium Intel $6 | Ubuntu 20.04 / SFO3 | 5.8 | Generatepress 3.0.4 |
| Premium AMD $12 | Ubuntu 20.04 / SFO3 | 5.8 | Generatepress 3.0.4 |
| Premium Intel $12 | Ubuntu 20.04 / SFO3 | 5.8 | Generatepress 3.0.4 |
Methodology
- Tests will be done in 2 phases. The first phase will include a Fresh WordPress installation to ensure that everything is working as expected. The actual meaningful test will be during the second phase with 10 plugins installed.
- WordPress is installed via Digitalocean’s 1-Click Installer that comes with Apache 2.4.41, MySQL 8.0.21, and PHP 8.0 out of the box.
- No caching/speed optimization will be used as we are trying to test the worst-case scenario till failure occurs
- Every performance test will be done thrice and the average of the three runs will be considered
- For Web Vitals Test, SpeedVitals testing tool is used on Standard Mobile configuration and server location is the United States
- In the second phase, the test will be done on a sample WordPress post with 10 Plugins installed: Wordfence, Yoast SEO, Contact Form 7, Header and Footer Scripts, Cookie Notice & Compliance for GDPR / CCPA, Tablepress, Smart Slider 3, Table of Contents Plus, ShortCodes Ultimate, WP Show Posts, AddToAny Share Buttons.
- All these plugins are either visible at the front-end and/or injecting scripts/stylesheets at the front-end. Using the Header and Footer Scripts, I’ve injected a random CPU-intensive Javascript code to emulate real-world websites.
Fresh WordPress Performance
Using our Web Vitals Measurement Tool, SpeedVitals, I’ve performed these tests three times and noted the average. This test isn’t of much significance especially in the case of LCP and CLS since we are testing on the exact same pages with hardly any content on them.
| Premium AMD $6 | Premium Intel $6 | Premium AMD $12 | Premium Intel $12 | |
|---|---|---|---|---|
| Performance Score | 100% | 99.5% | 100% | 100% |
| LCP | 1.5 sec | 1.7 sec | 1.5 sec | 1.5 sec |
| CLS | 0.00 | 0.00 | 0.00 | 0.00 |
| TBT | 0 ms | 0 ms | 0 ms | 0 ms |
| TTFB | 80 ms | 165 ms | 75 ms | 105 ms |
However, the TTFB of the four configurations turned out to be different. Both the AMD droplets had a TTFB below 80 ms while the Intel droplets struggled to go below 100 ms. Intel’s $6 Plan was the worst performer in this test.
Performance after Installing 10 Plugins
After installing the 10 plugins and creating a sample ‘Lorem Ipsum’ blog post with a dozen images, I attempted the Web Vitals Test, a Stress test on Loader.io and Geekbench Test.
Web Vitals Test
After taking the average of three runs, I didn’t note anything too significant in the performance scores, LCP or CLS scores. But the difference in Blocking Time and TTFB in the four droplets was massive.
| Premium AMD $6 | Premium Intel $6 | Premium AMD $12 | Premium Intel $12 | |
|---|---|---|---|---|
| Performance Score | 61.5% | 60.5% | 67% | 57.5% |
| LCP | 4.5 sec | 4.1 sec | 4.45 sec | 5.05 sec |
| CLS | 0.00 | 0.00 | 0.00 | 0.00 |
| TBT | 495 ms | 585 ms | 230 ms | 500 ms |
| TTFB | 185 ms | 385 ms | 365 ms | 410 ms |
Both the AMD droplets comfortably outperformed Intel again in this test. Looks like we are getting close to picking a winner. Let’s see if AMD can outperform Intel in the Stress Test as well.
Stress Test
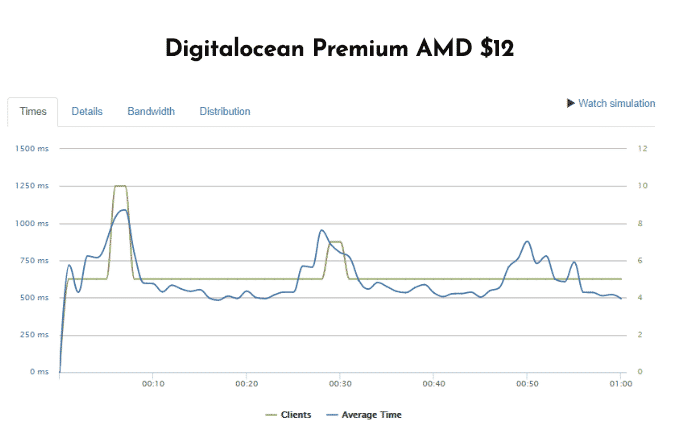
I made the following configuration on Loader.io with a total of 300 GET requests to the droplets over a span of one minute. So, each droplet will get 5 requests every second.
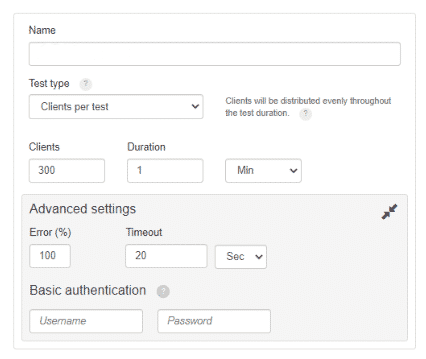
Here are the stats of the Stress Test.
- Premium AMD $6
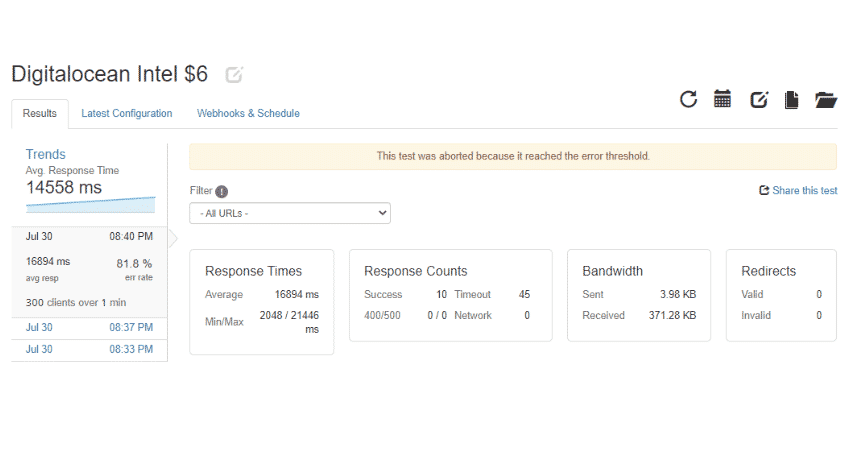
- Premium Intel $6
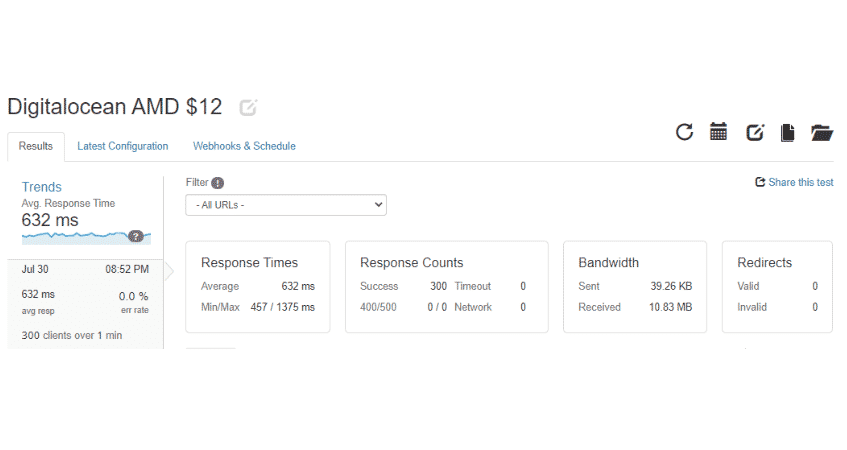
- Premium AMD $12
- Premium Intel $12
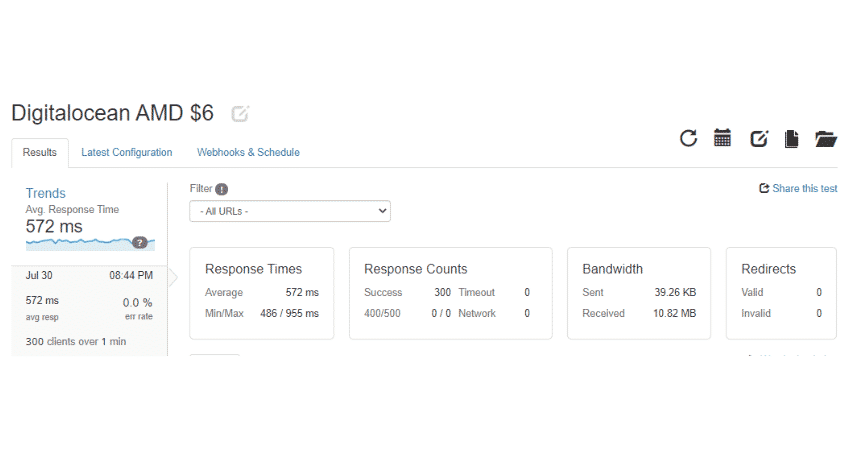
In these graphs, you can see the timeline of clients vs average response times.
- Premium AMD $6
- Premium Intel $6
- Premium AMD $12
- Premium Intel $12


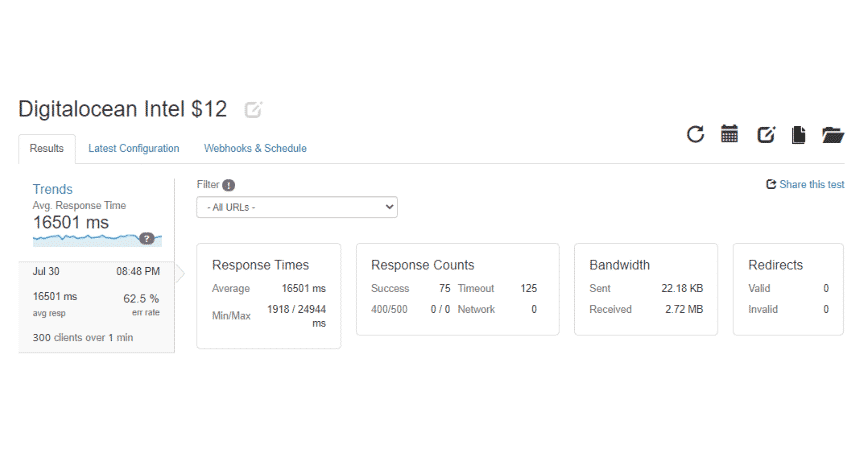
This test turned out to be a disaster for both the Intel droplets as the Database crashed early in the test and I started to get the infamous WordPress error “Error establishing a database connection”.
| Premium AMD $6 | Premium Intel $6 | Premium AMD $12 | Premium Intel $12 | |
|---|---|---|---|---|
| Avg. Response Time | 0.57 sec | 14.56 sec | 0.63 sec | 16.5 sec |
| Error Rate | 0.00% | 81.8% | 0.00% | 62.5% |
| Successful Response | 300/300 | 10/300 | 300/300 | 75/300 |
Despite having the same amount of RAM, AMD droplets managed to give successful requests to all 300 requests while Intel’s $6 droplet could serve only 10 while the $12 droplet could serve just 75 before crashing.
Yes, this is not the representation of a real-world scenario. A website getting 5 requests a second wouldn’t be using a $6/month or $12/month plan in the first place and also not using any caching plugin has made the test more demanding.
Lastly, I’m sure Intel’s Droplets would have performed a lot better in this test if Nginx or OpenLiteSpeed was used instead of Apache.
But considering that all these droplets are priced equally and running the exact piece of software, we can call it an apples-to-apples comparison. The pricing doesn’t make sense but if we will compare the pricing of Intel’s Xeon and AMD’s Epyc processors, it will start to make more sense why Digitalocean had to price them equally.
Geekbench Test
I used Geekbench’s Linux CLI to run this benchmark. These are performed on Geekbench 5.3.1. The test failed to run on both the $6 droplets due to the low system memory. Here are the results for the $12 droplets.
| Premium AMD $6 | Premium Intel $6 | Premium AMD $12 | Premium Intel $12 | |
|---|---|---|---|---|
| Test Status | Failed (Low-Memory) | Failed (Low-Memory) | Successful | Successful |
| Single-Core Score | – | – | 626 | 376 |
| Multi-Core Score | – | – | 695 | 378 |
| HTML5 Score (SC) | – | – | 377 | 360 |
| SQLite Score (SC) | – | – | 369 | 259 |
| Text Rendering (SC) | 449 | 257 | ||
| Test Report URL | – | – | Geekbench Report | Geekbench Report |
These benchmarks would give you an idea of why Intel struggled so bad in the previous tests. The AMD CPU was 66% faster in Single-Core Test and 83% faster in Multi-Core Test.
Conclusion
I was expecting AMD to win with a decent margin but it turned out to be a bloodbath. Intel’s Cascade Lake CPUs start to struggle as the number of requests begins to increase.
Intel’s Premium droplets aren’t that bad when we compare them to Digitalocean’s basic $5 plans but the Premium AMD droplets are in a completely different league and it is a no-brainer to go with AMD ones in every price segment.
I don’t see a point in going with Digitalocean’s Premium Intel droplets unless the AMD one isn’t available in your preferred data center.
I hope Digitalocean can bring AMD droplets to more locations in the near future and I also hope that managed Cloud Hosting Providers like Cloudways will also introduce Digitalocean’s Premium AMD plans just like they did with Intel ones.