
Website Speed Test &
Optimize Page Speed
Run a page speed test from 30+ locations and devices. Measure Core Web Vitals and get clear optimization tips.
Trusted By Users from 1000+ Companies

















The Next Generation of Website
Speed Testing


Features to make your Website
Lightning Fast
Performance Monitoring
Performance Alerts
Get Alerts via Email and Slack when your performance score drops below a threshold and fix them before they affect User Experience & Search Rankings
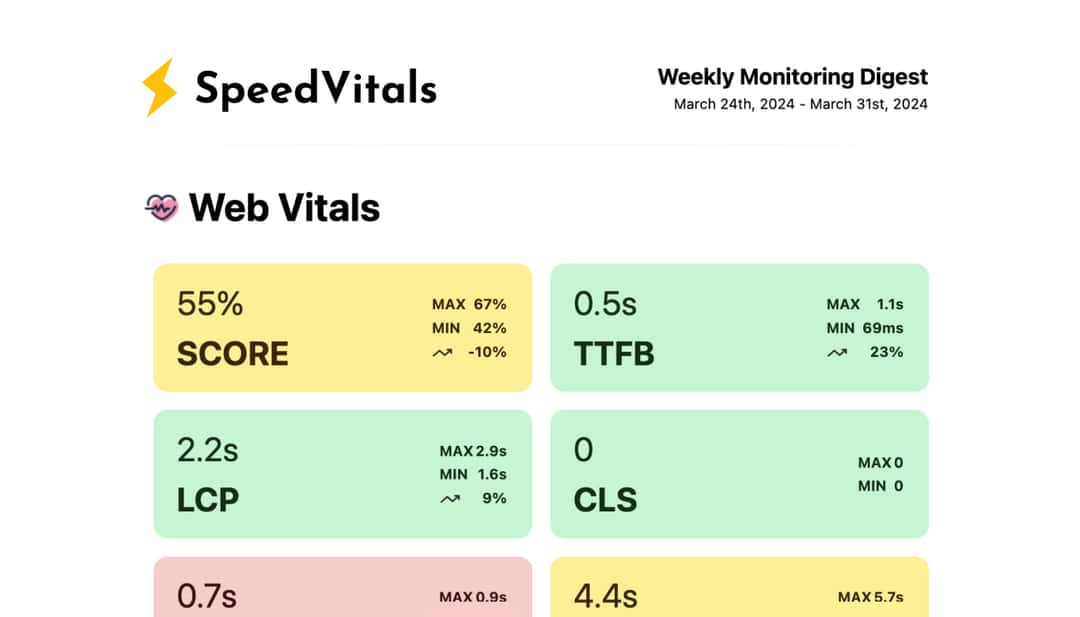
Weekly Digest
Get a summarized digest of the performance of all your websites over the last one week
Global Test Locations
Multi-Location Test
Perform Batch Test on a URL from up to 35 Locations with a single click
TTFB Testing
SpeedVitals global TTFB Test checks global performance of your website. Cache Status and CDN Detection features makes it the best tool for TTFB Testing

In-Depth Reports
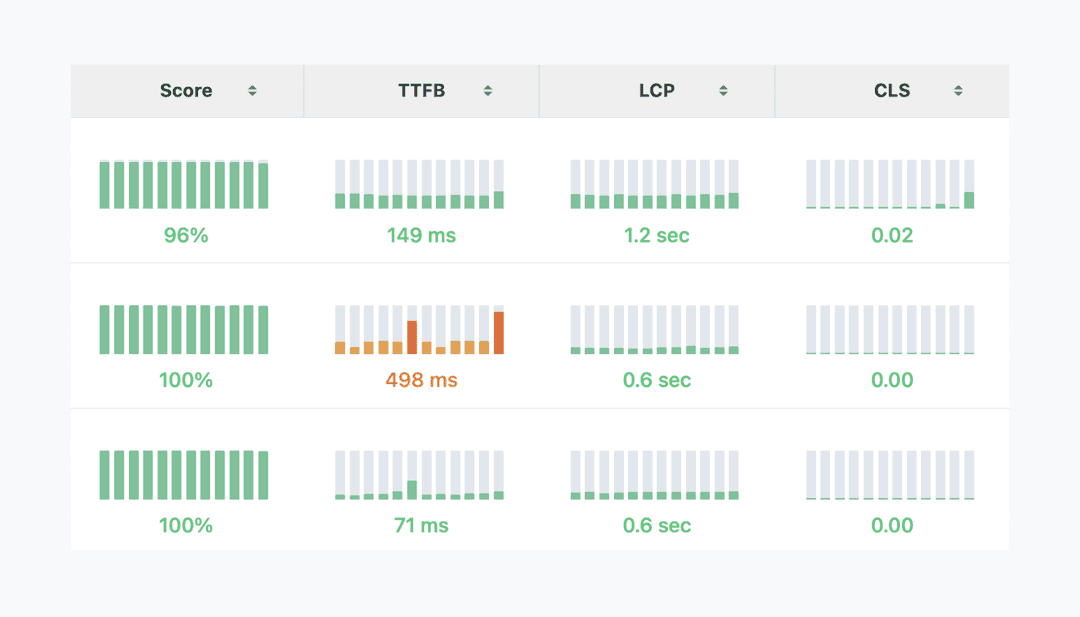
Performance Charts
Get all the important performance charts like Waterfall, Resource Summary, Unused Resources, and Domain Map
No-code Experiments
Implement various optimizations without touching the code.

Real-world Performance
Historic Performance Data
View Historic Real-world Performance Data over a period of 12 months
Compare with competitors
SpeedVitals Core Web Vitals Checker allows you to check the Real-world Performance of all your competitors
Why people love SpeedVitals
I use SpeedVitals daily to understand what is holding a WordPress site back and how to meet Core Web Vitals metric thresholds. Their TTFB test tool is one of my favorites!

Brian Jackson
Perfmatters
Useful and well designed new free Core Web Vitals validation tool, including both lab and field data.

Aleyda Solis
LearningSEO.io
Neat little tool allowing you to check your website speed from all around the world.

Pierre de Wulf
ScrapingBee
Explore Free Tools
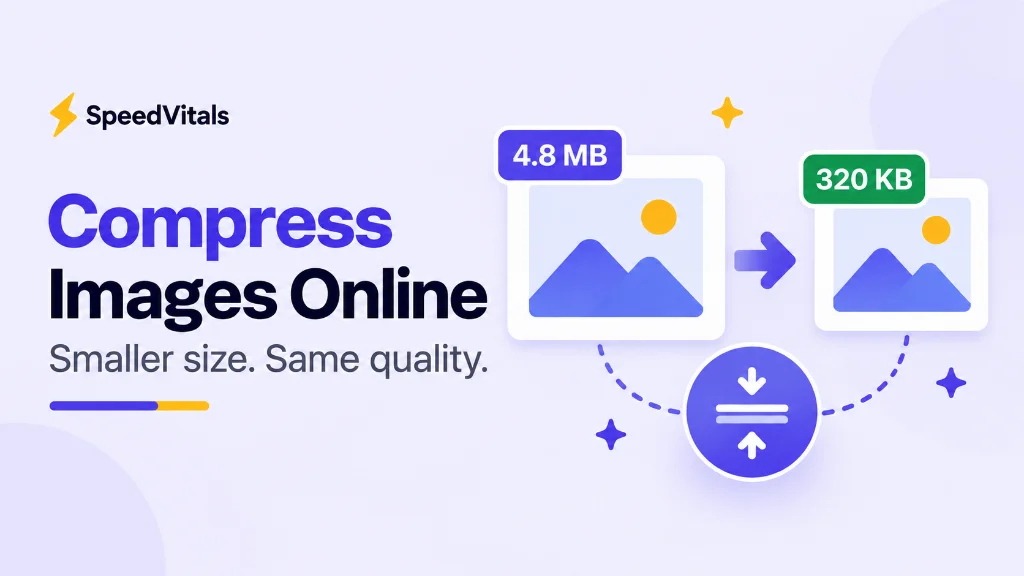
Image Compressor
Compress and convert images locally to AVIF, WebP, JPEG XL, and PNG with zero server uploads.

SEO Analyzer
Audit on-page SEO with checks for meta tags, headings, structured data, robots, and sitemaps.
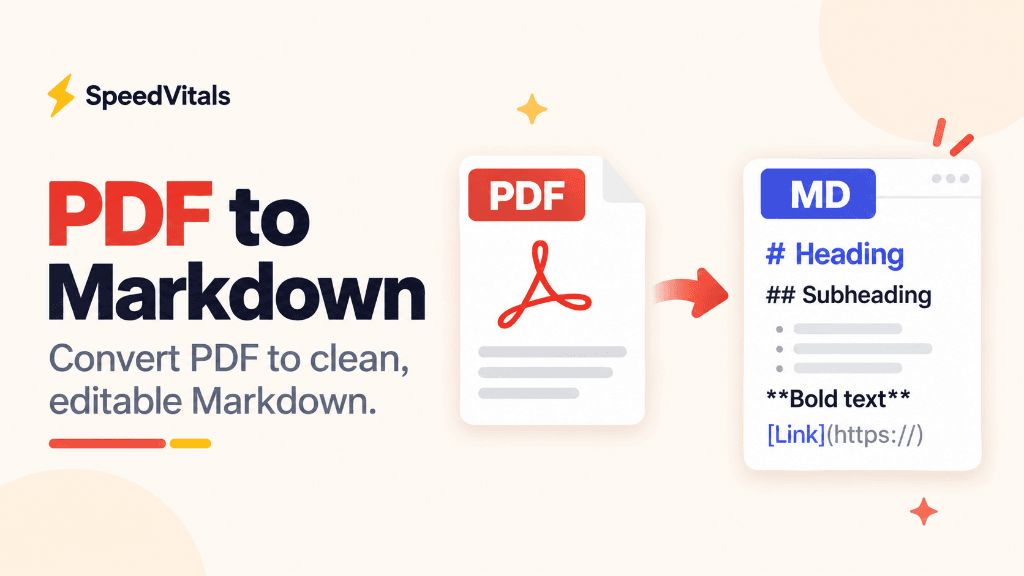
PDF to Markdown
Convert PDF documents into clean, LLM-ready GitHub-Flavored Markdown tables, headings, and lists.

PNG to AVIF Converter
Convert PNG images to next-gen AVIF format locally in your browser with up to 80% file size savings.
Latest Blog Posts

How to Self-Host Google Fonts on Every Major Platform
Learn how to self-host Google Fonts on WordPress, Shopify, Webflow, Next.js, and 16 more platforms, then confirm no Goog...
Read the article
Does Page Speed Affect Your Visibility in AI Search Results?
Page speed can influence AI search visibility indirectly by affecting crawling, rendering, indexing, and user experience...
Read the article
Website Performance Optimization: What Matters the Most
Website performance optimization ranked by impact: fix TTFB, HTML delivery, LCP discovery, JavaScript, and images before...
Read the article
Cloudflare Enterprise Review: Is it worth it?
Is Cloudflare Enterprise from your web host worth it? We compare hosting bundles with Free plan HTML caching, plus costs...
Read the articleFrom test to faster page
How to Run a Page Speed Test and Improve Your Website
A useful website speed test should show more than a single score. It should help you reproduce the experience of real visitors, identify the resources slowing the page down, and decide which optimization will have the greatest impact.
- Step 1
Enter the page you want to test
Paste a public URL into the form above. Test the exact page that matters, such as a landing page, product page, or article, instead of checking only the domain.
- Step 2
Choose a realistic device and location
Select a device, connection, and test location that reflect your visitors. Mobile hardware and longer network distances can expose problems that a fast local desktop test misses.
- Step 3
Review the report and fix the largest delays
Start with failed Core Web Vitals, slow server response, render-blocking resources, oversized images, and long JavaScript tasks. Retest after each meaningful change.
What the page speed test measures
SpeedVitals combines a configurable lab test with detailed diagnostics. The lab test measures loading, visual stability, and main-thread blocking under controlled conditions, while supporting metrics and the request waterfall help reveal why a page is slow.
- Largest Contentful Paint (LCP)
- Shows how quickly the largest visible image or text block appears. A slow LCP often points to server delays, a heavy hero image, or render-blocking CSS.
- Total Blocking Time (TBT)
- Measures how long the main thread is blocked by long tasks during page load. Excessive JavaScript and expensive rendering work are common causes of high TBT.
- Cumulative Layout Shift (CLS)
- Measures unexpected movement while the page loads. Images without dimensions, injected content, and late-loading fonts can create layout shifts.
- Supporting performance metrics
- TTFB, FCP, and Speed Index provide additional context about server response, initial rendering, and how quickly visible content appears.
Turn test results into faster pages
Work from the earliest bottleneck in the loading process, then retest under the same conditions so the before and after results are comparable.
- Improve server response time and caching. Use the global TTFB test to compare response times from multiple regions and confirm whether your CDN is serving cached content.
- Optimize the largest above-the-fold element. Find it with the LCP Finder, compress images, use responsive image sizes, and preload only critical assets.
- Reduce JavaScript work by removing unused code, splitting large bundles, and delaying non-critical scripts. This can improve responsiveness and shorten Total Blocking Time.
- Reserve space for images, ads, and embeds. Use the CLS Finder to identify the elements responsible for unexpected movement.
One test is a snapshot, so run several tests before drawing conclusions. Compare the median result, keep the device and location consistent, and use the batch website speed test when you need to check multiple pages or locations efficiently.
Test Your Website Speed