GTMetrix Alternatives - List of Best Tools

Are you looking for a Website Performance Testing Tool to replace GTMetrix?
We have compiled a list of the best GTMetrix alternatives that offer some exceptional features. All the tools mentioned in this article have been extensively used by our team and all of them have something good to offer. Except for just one tool in this list, the rest are either Free or offer a Free plan with limitations.
Web Performance & Core Web Vitals are crucial for your website and the following tools will help make your optimization journey easier.
Here is the list of GTMetrix alternatives that you can try!
SpeedVitals
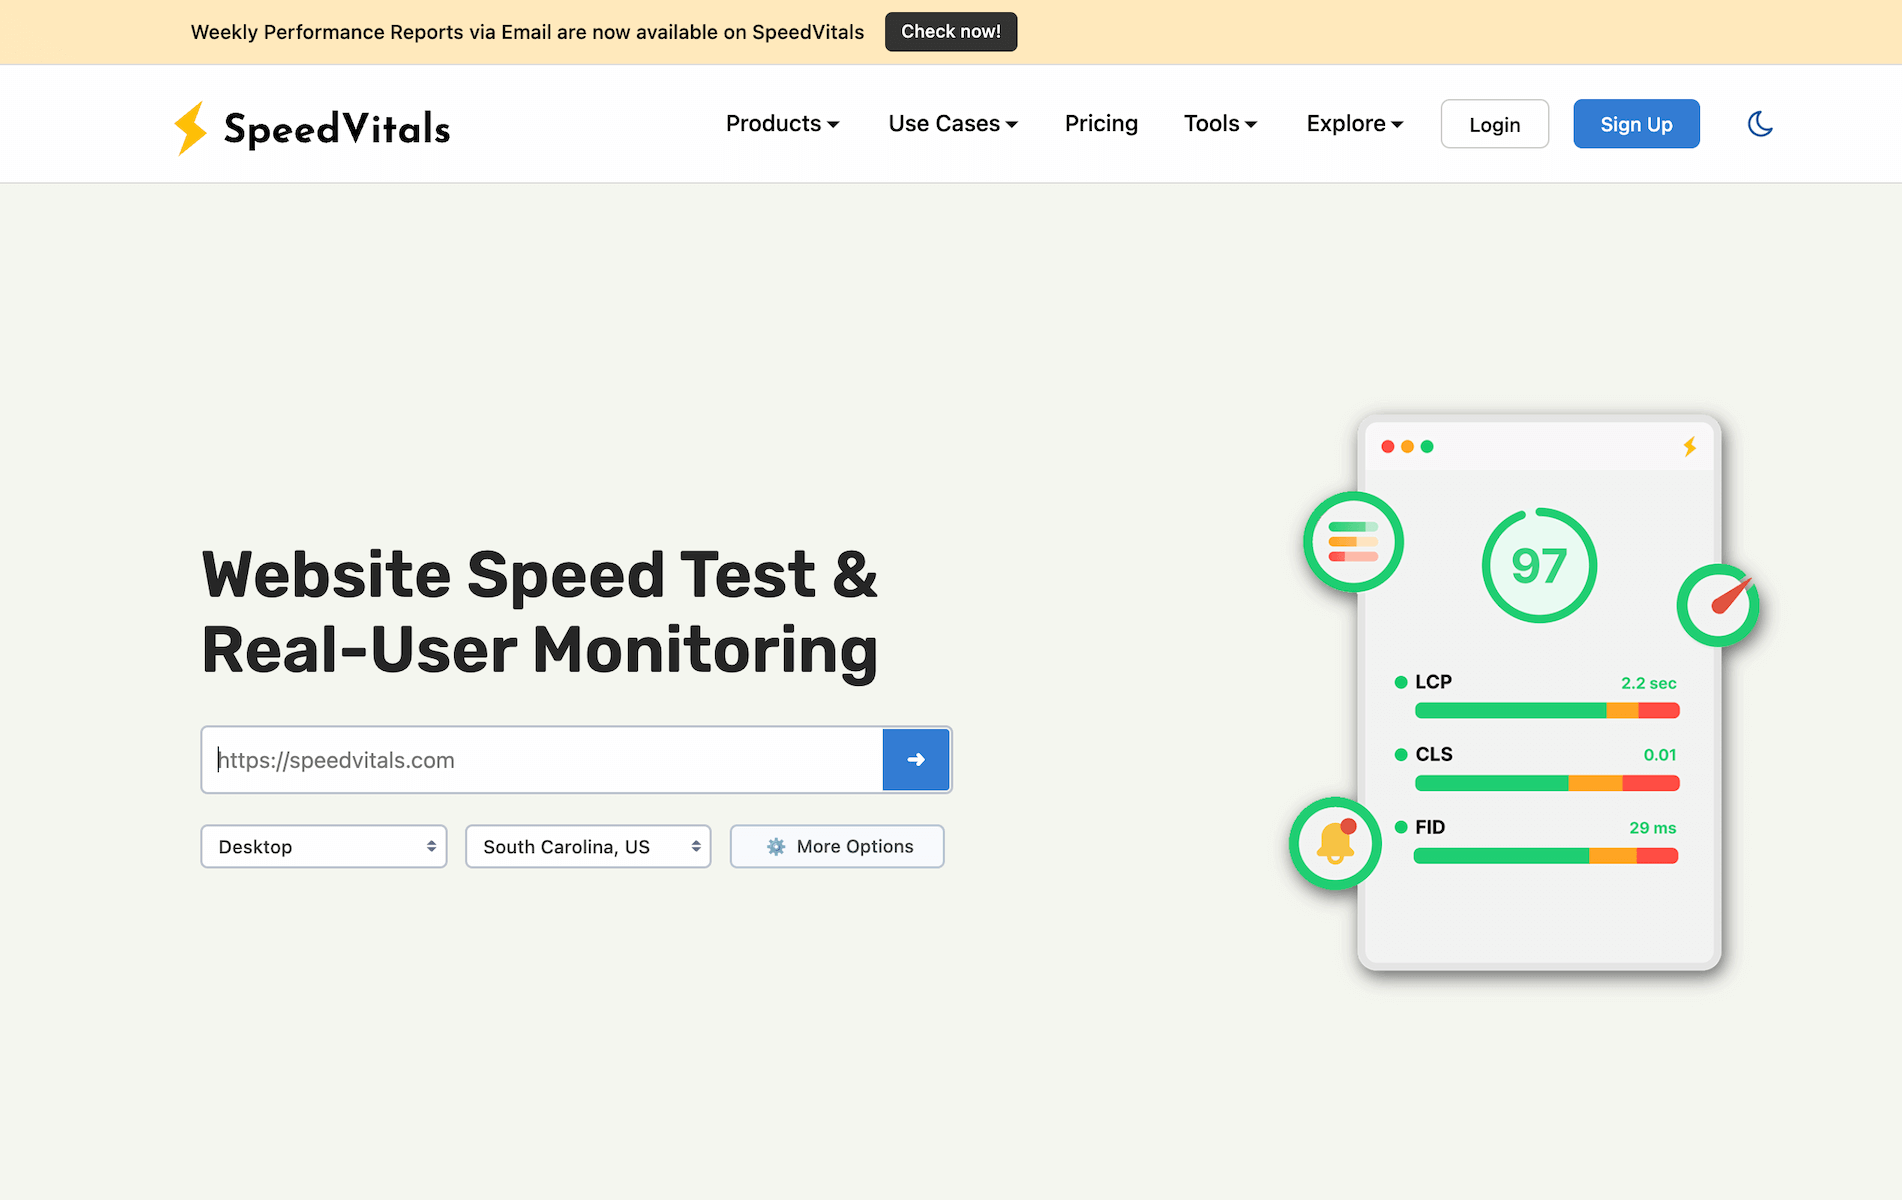
SpeedVitals is one of the best alternatives to GTMetrix. It not only offers every major GTMetrix feature, but also offers several other incredible features such as Batch Testing, Field Data, No-code Experiments, and CDN Detection.
SpeedVitals also offers more Testing Locations than GTMetrix (35 locations vs 22 Locations in GTMetrix). The Multi-Location Batch Test feature of SpeedVitals allows running 35 Tests across all locations with just one click.
Just like GTMetrix, SpeedVitals also offers a Weekly Digest but it is only available on Paid Plans.
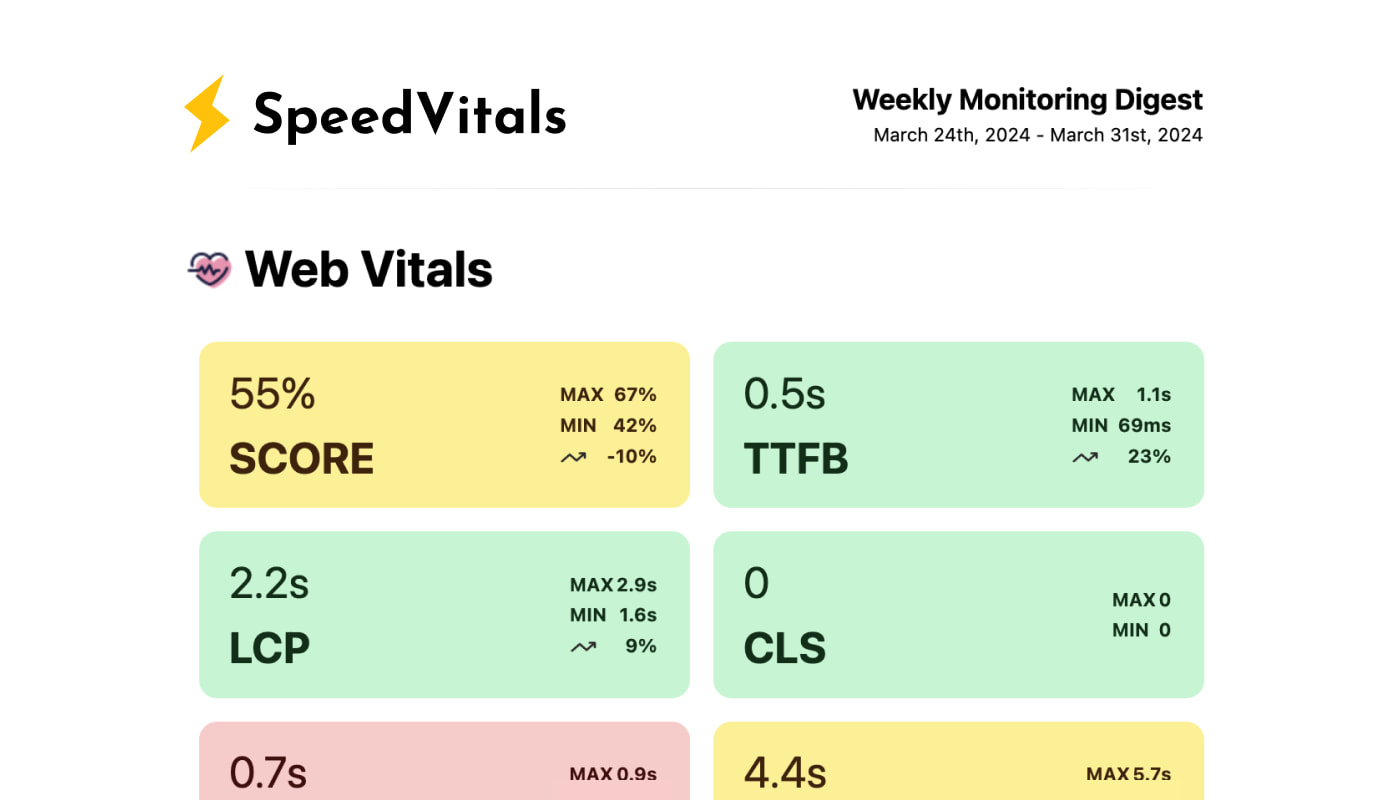
The SpeedVitals Weekly Digest not only includes the Weekly Summary of Performance Monitoring but also that of TTFB Monitoring. The only major con of SpeedVitals is the lack of Whitelabled Reports and the lack of Teams feature.
SpeedVitals is the perfect alternative to GTMetrix and it is a big upgrade if you're an existing GTMetrix user.
| Pros. | Cons. |
|---|---|
| ✅ Easy to Use | ❌ No side-by-side comparison |
| ✅ Batch Testing | ❌ No Teams Support |
| ✅ 35 Test Locations | ❌ No White-labeled Reports |
| ✅ No-Code Experiments | |
| ✅ Waterfall Charts | |
| ✅ Cache Status | |
| ✅ Pro Optimization Tips | |
| ✅ CLS GIF | |
| ✅ 3rd Party Domains Map | |
| ✅ Advance Test Options | |
| ✅ Performance Alerts | |
| ✅ Testing API | |
| ✅ Field Data | |
| ✅ CDN Detection |
PageSpeed Insights
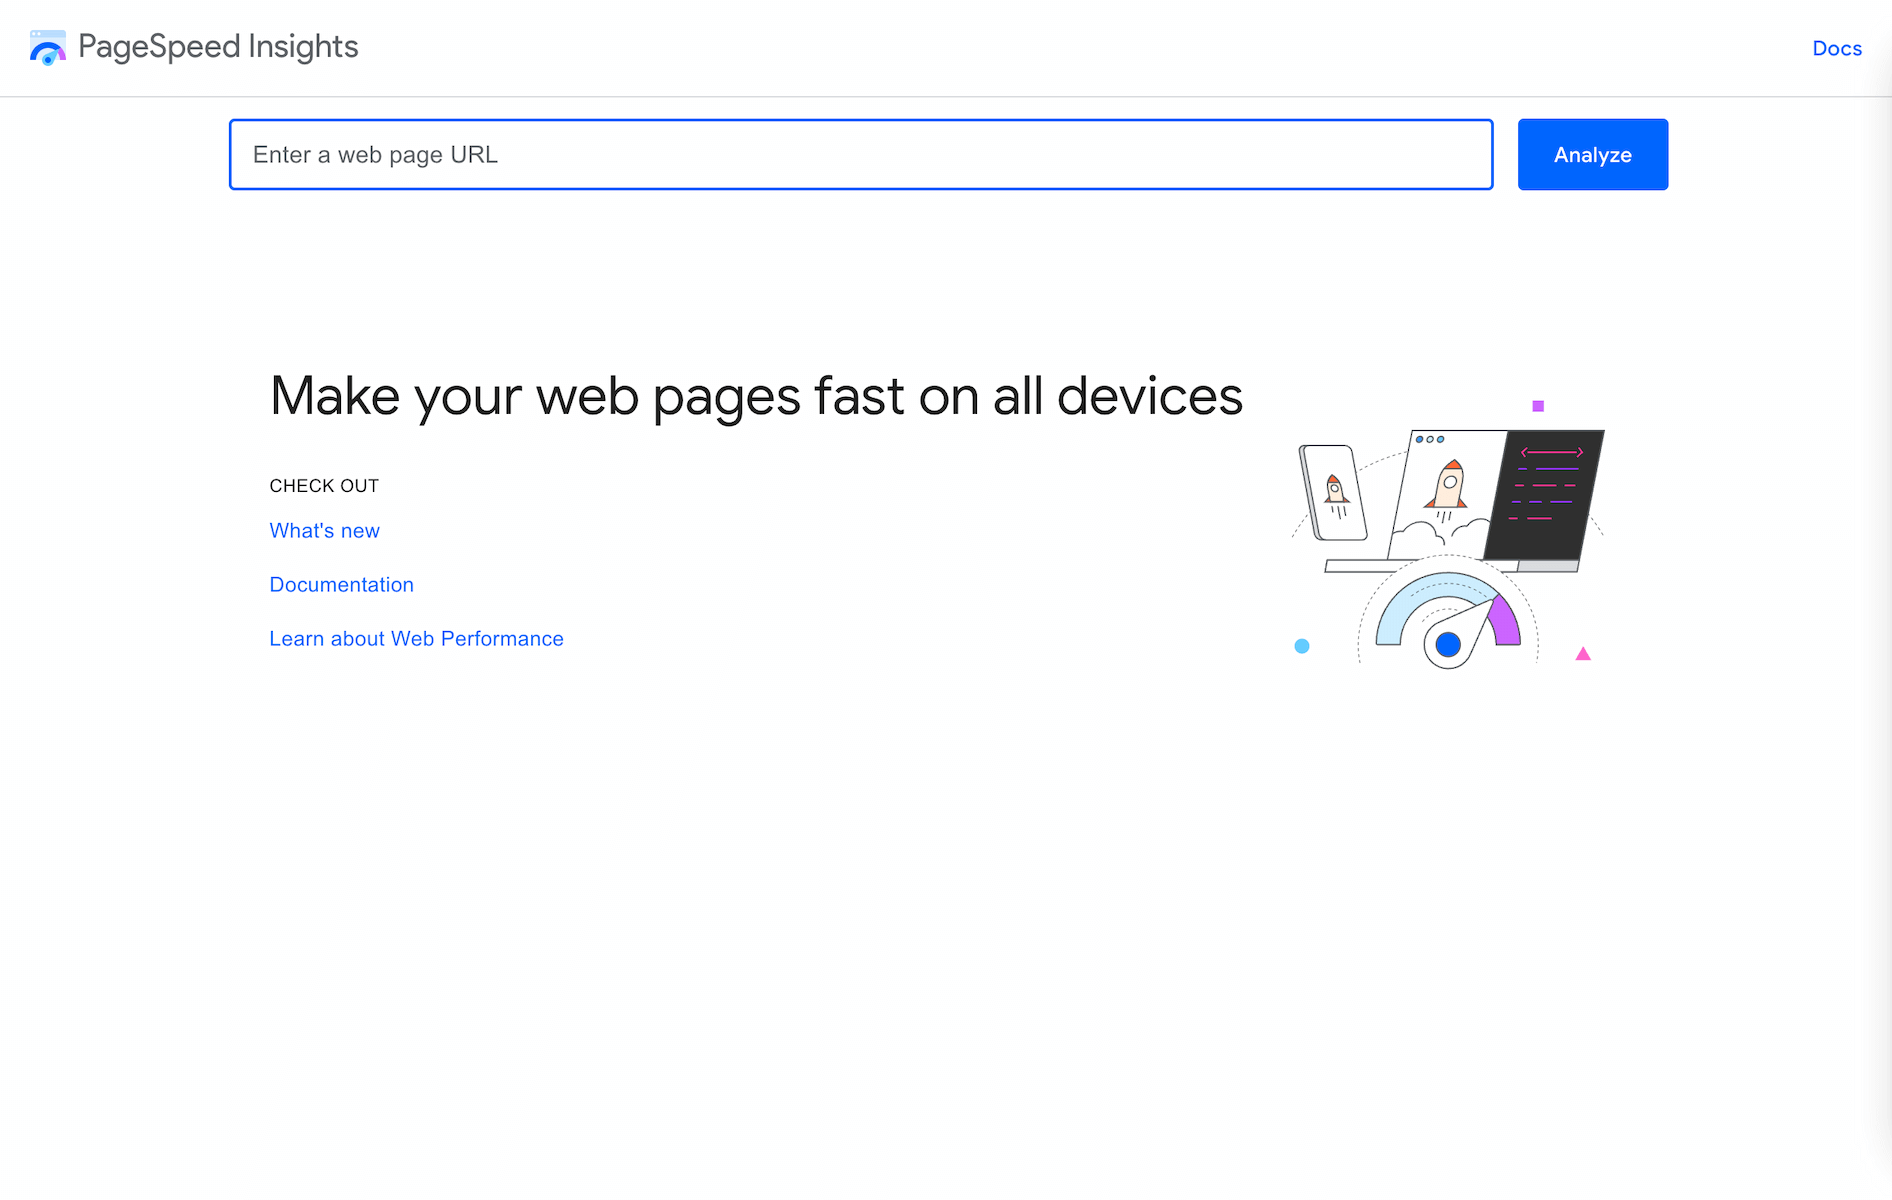
If you are familiar with GTMetrix, it is highly unlikely that you wouldn't have used PageSpeed Insights before.
Google PageSpeed Insights gives a very similar report to Chrome Lighthouse with the addition of Field Data. However, the biggest advantage of using PageSpeed Insights over running Lighthouse locally is that PSI runs on a controlled environment that is calibrated for throttling. Running Lighthouse locally can give inconsistent results due to the difference in your system hardware and background tasks.
PageSpeed Insights is completely free to use and its simple User Interface makes it the perfect tool for beginners. However, advanced users might not find it good enough due to the lack of various major features.
PageSpeed Insights lacks Request Waterfall, which is one of the biggest assets for debugging Web Performance. It also doesn't let you choose a Test Location, use a custom Device configuration, or Network Throttling. All these features are crucial to test web performance that is close to the network/device/location configuration of real users visiting your website.
For example, PageSpeed Insights currently uses Moto G Power on a slow 4G Connection as default for Mobile Testing. However, if your average website owns a flagship device on a 5G connection, you'll get worse results compared to what real users are experiencing. The vice versa of this scenario is true as well. This is also the reason why Real-User Monitoring (RUM) is recommended to get actual performance data of your website while Lab Testing is only recommended for debugging purposes.
For any advance user, I wouldn't recommend using PageSpeed Insights but it is still a great tool to check Field Data.
We also have an article on PageSpeed Insights alternatives.
| Pros. | Cons. |
|---|---|
| ✅ Easy to Use | ❌ Cannot select Test Location |
| ✅ Free to use | ❌ No Batch Testing |
| ✅ Unlimited Testing | ❌ No Alerts |
| ✅ Field Data | ❌ No Waterfall |
| ✅ Testing API | ❌ No Advance Test Options |
| ❌ No Video Capture | |
| ❌ No Resource Graphs | |
| ❌ No side-by-side comparison | |
| ❌ No Teams Support | |
| ❌ No White-labeled Reports |
WebPageTest
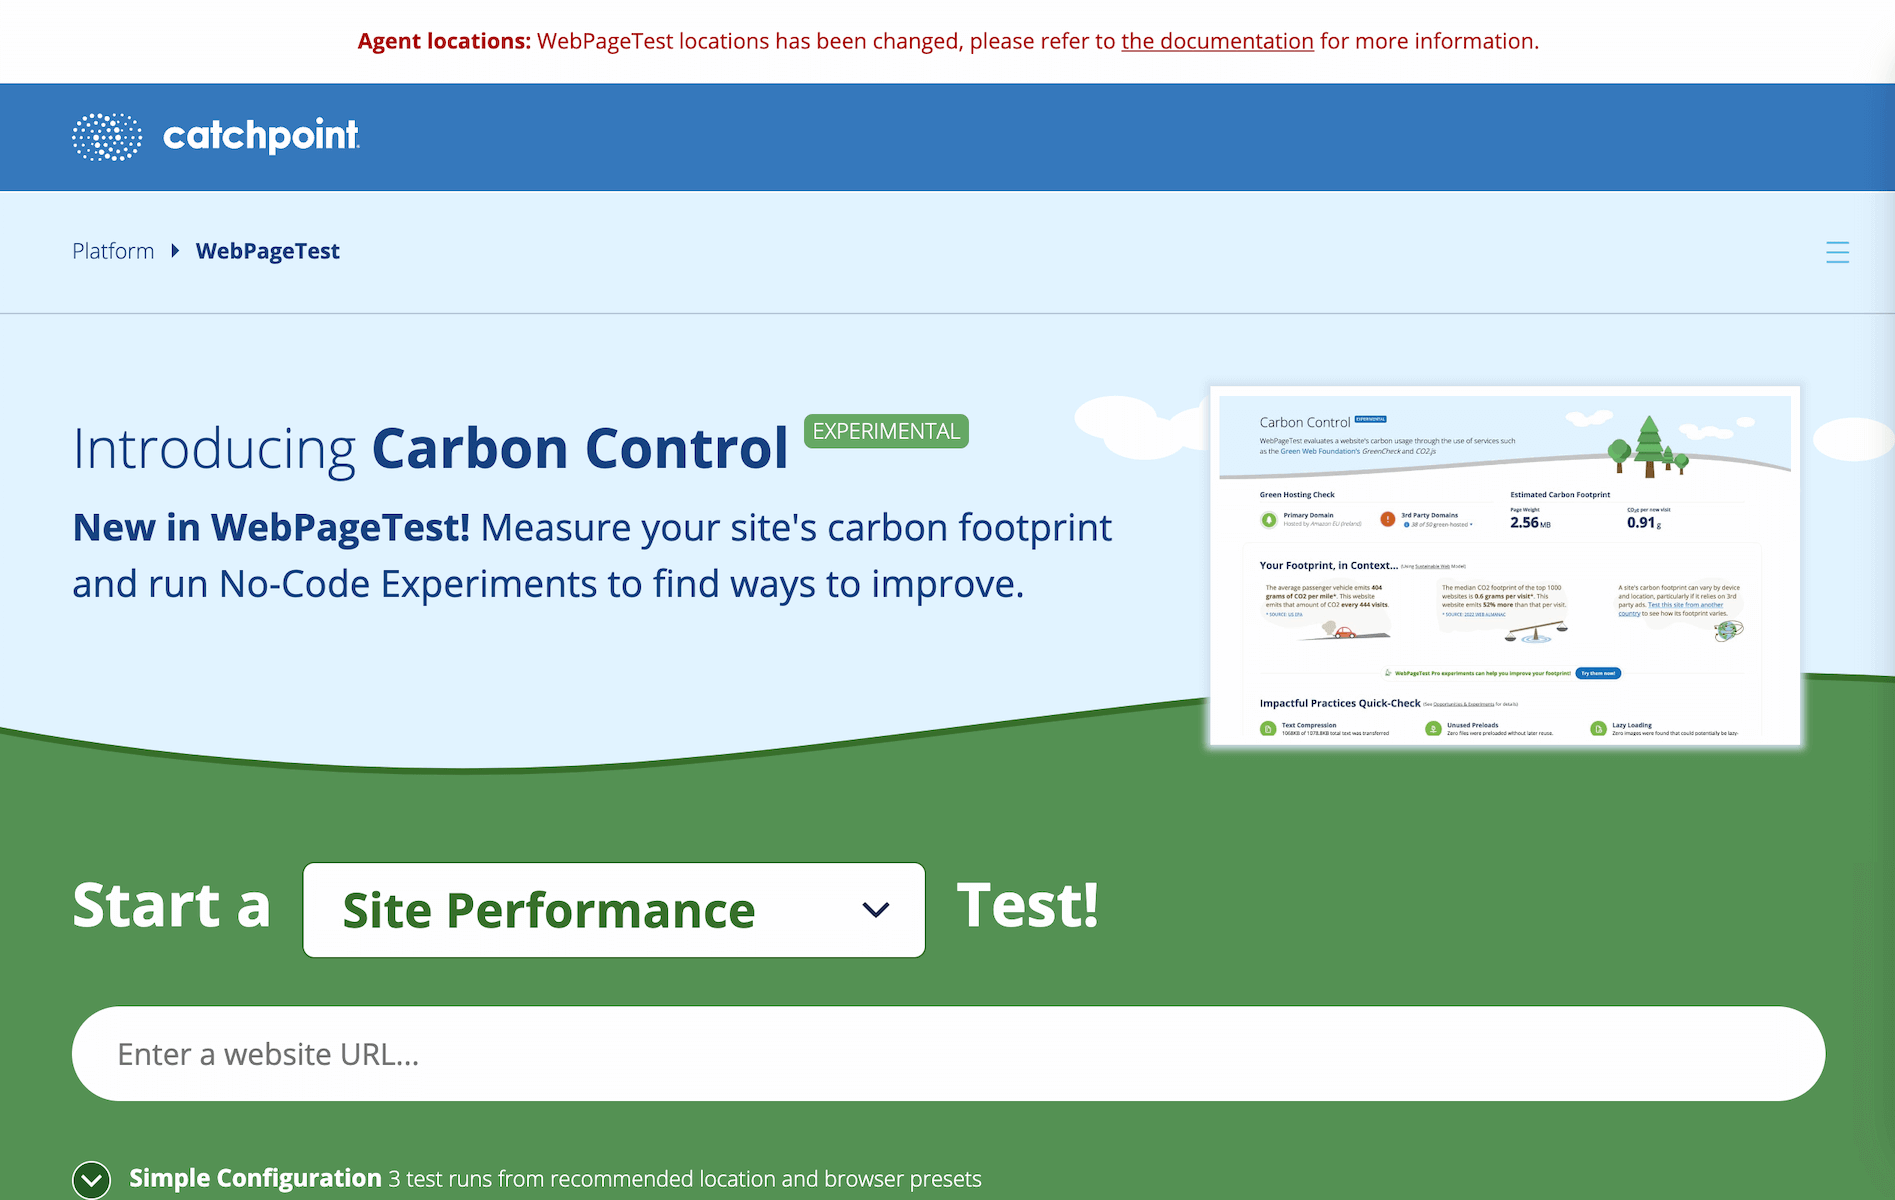
WebPageTest is an open-source tool that has been around for more than a decade. Yet, It is a proven tool that has consistently evolved and innovated over the years and offers many advanced testing features that every other tool lacks.
By default, WebPageTest displays runs a test 3 times and shows the average result. This makes the results more accurate.
However, the biggest and probably the only reason I don't recommend WebPageTest in 2024 is the unorganized and complex User-Interface that can scare away anyone new to Web Performance. The learning curve of WebPageTest is high and for most people, it is not worth it unless you are experienced and require all the advanced configuration offered by WebPageTest.
| Pros. | Cons. |
|---|---|
| ✅ Waterfall Chart | ❌ Complex to use |
| ✅ Advance Test Options | ❌ Confusing UI |
| ✅ Testing API | ❌ No Caching Status |
| ✅ Field Data | ❌ No Historic Field Data |
| ✅ No-code Experiments | ❌ No CDN Detection |
| ✅ Performance Alerts | ❌ No Teams Support |
| ✅ CLS GIF | ❌ No White-labeled Reports |
DebugBear
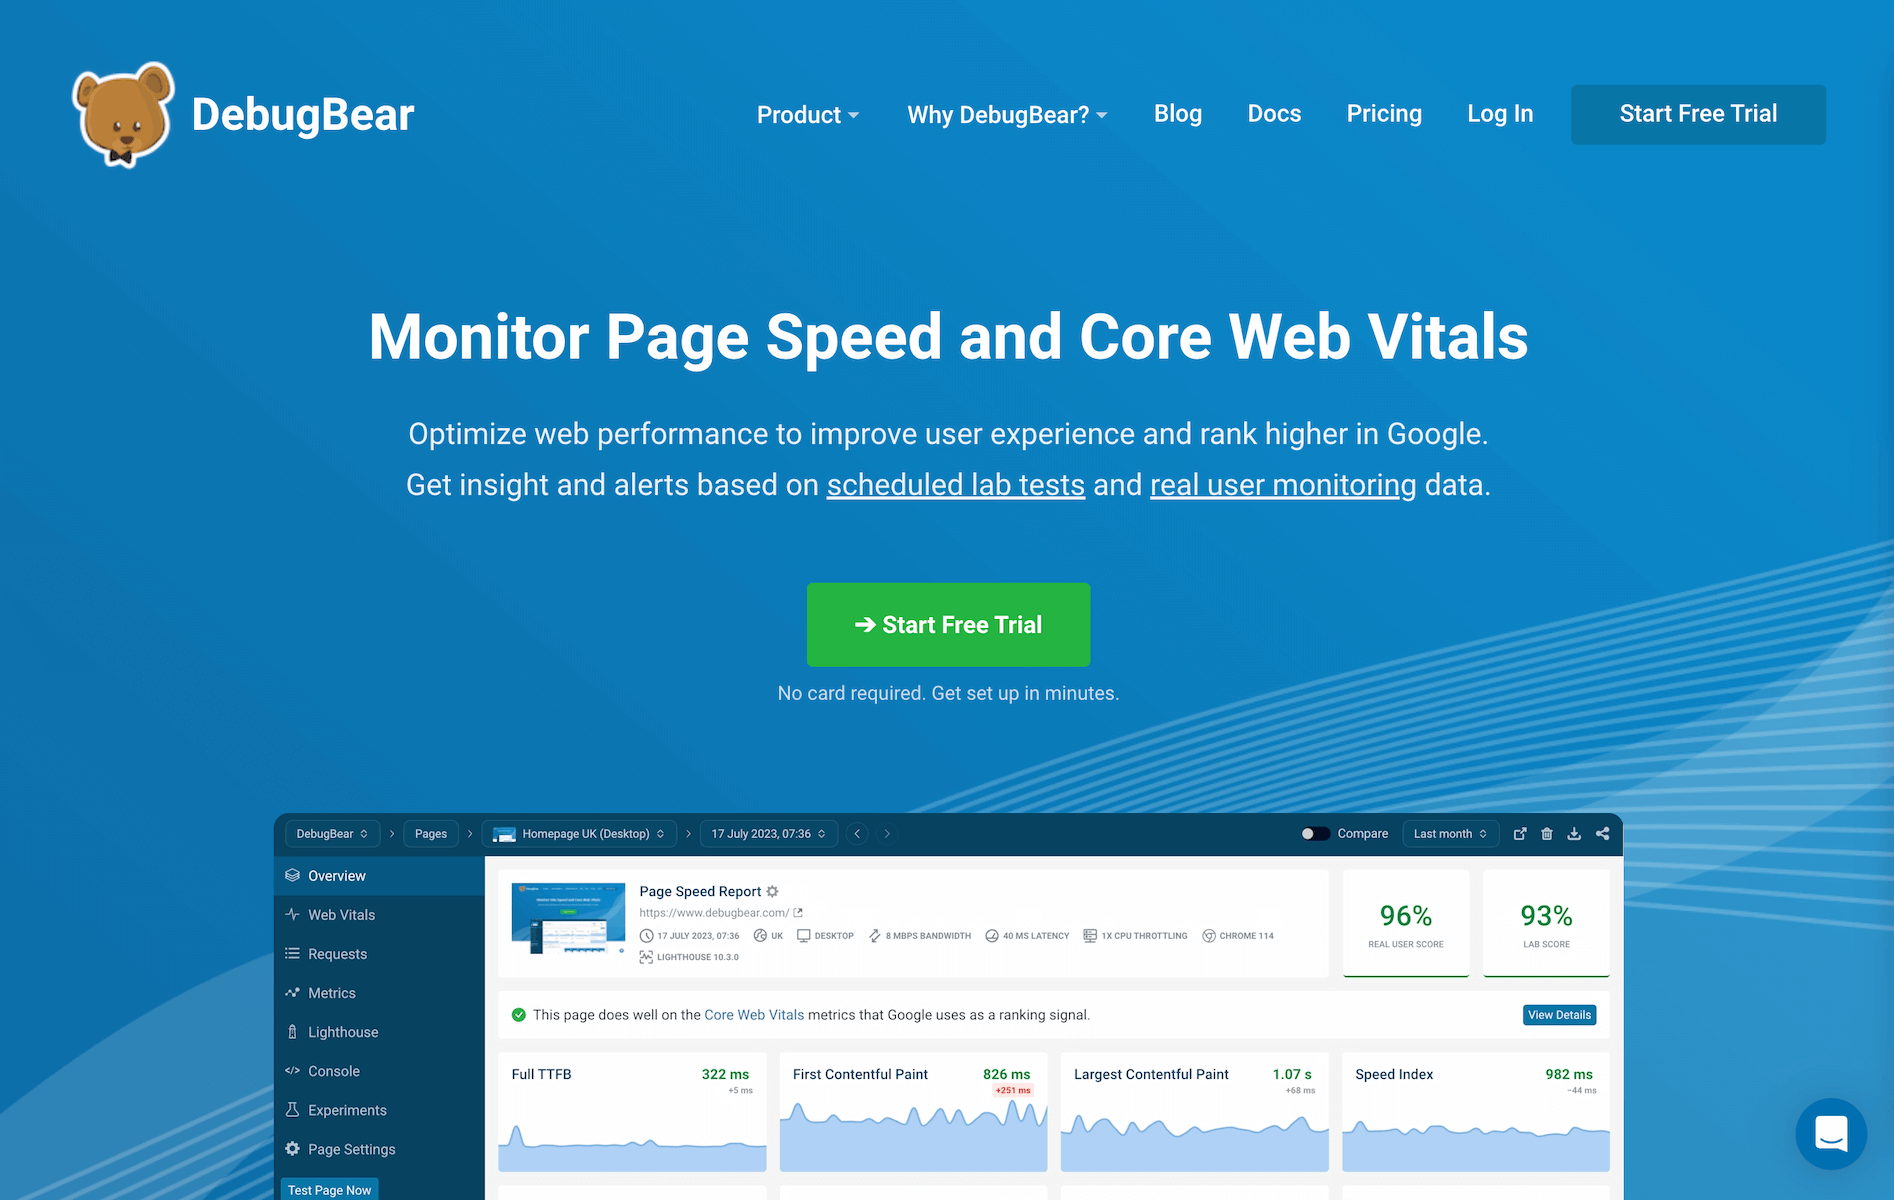
After SpeedVitals, DebugBear is my second favorite tool for Web Performance Testing & Monitoring.
It is an exceptional Web Performance Tool that offers almost all the features offered by GTMetrix but also offers some great additional features like No-code Experiments, Field Data, and Real-User Monitoring.
For Lab Testing, I love DebugBear's Waterfall as it contains various badges to identify requests that are Render-blocking, ones that were Preloaded, Lazy-loaded, Deferred, etc. I highly recommend DebugBear as an alternative to GTMetrix.
However, DebugBear is not free and their cheapest plan might not be affordable for most users, especially those who use Web Performance Testing tools occasionally.
| Pros. | Cons. |
|---|---|
| ✅ Easy to Use | ❌ No Batch Testing |
| ✅ Detailed Waterfall Chart | ❌ No Free Plan |
| ✅ Field Data | ❌ No CDN Detection |
| ✅ Performance Alerts | ❌ No Cache Status |
| ✅ Testing API | |
| ✅ No-Code Experiments | |
| ✅ Teams Support | |
| ✅ Whitelabled Reports | |
| ✅ Advance Test Options |
Chrome Lighthouse
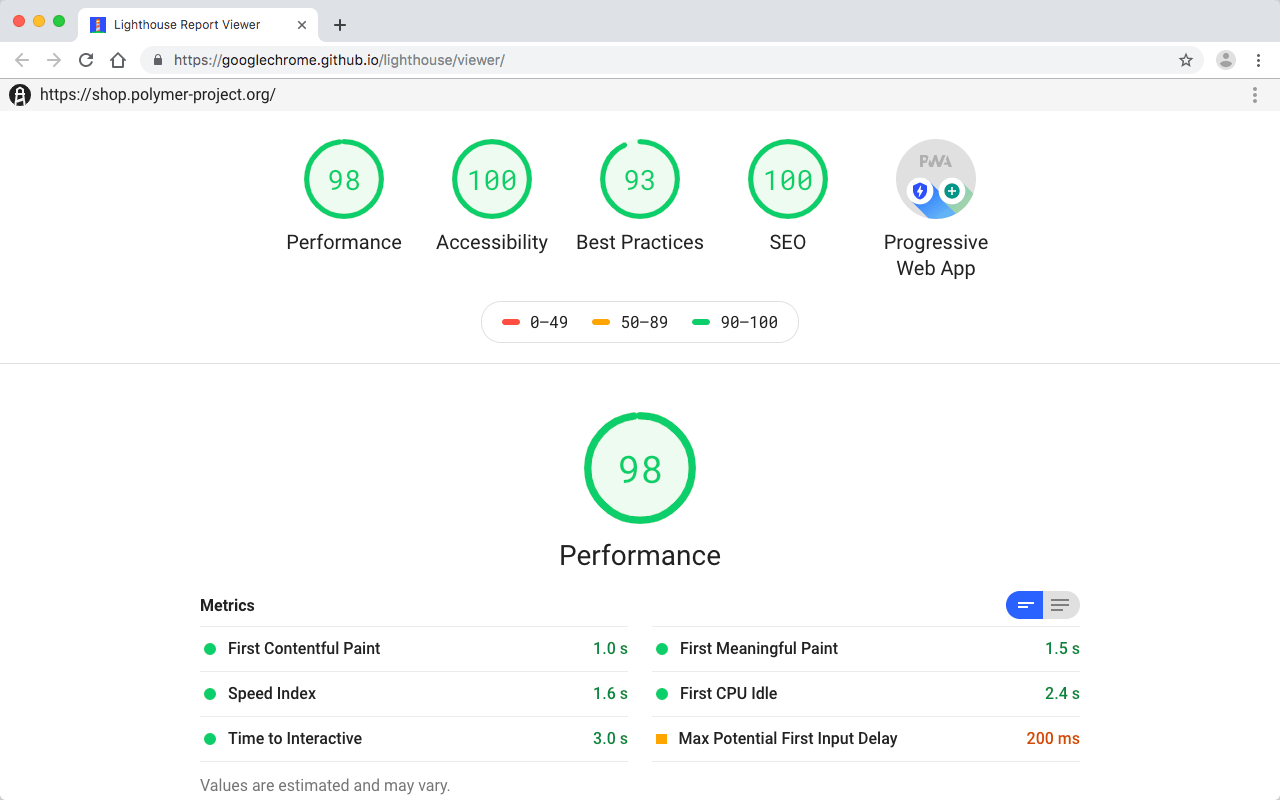
Lastly, we have Chrome Lighthouse. It is available via Google Chrome's Developer Tools and it can also be locally installed on your system.
All of the tools mentioned above use Google Chrome Lighthouse as their base for measuring performance metrics. However, everyone's implementation of Lighthouse and throttling methods differ.
As mentioned previously in the section of PageSpeed Insights, it has nearly all the same cons as PageSpeed Insights. Moreover, PageSpeed Insights's Tests are run under a controlled environment while Lighthouse tests run locally. This is a big problem as every device has different hardware performance and that can affect the results.
To get accurate results from Chrome Lighthouse, you will need to calibrate the throttling settings for your system's performance. Even after calibration, you could get inconsistent results due to other active programs and background tasks that are consuming CPU and RAM. For this reason, I recommend using Lighthouse only for Development projects that are not yet live on the Internet.
For Production sites, I would instead use PageSpeed Insights, SpeedVitals, or DebugBear to get more accurate and consistent results.
| Pros. | Cons. |
|---|---|
| ✅ Easy to Use | ❌ Cannot select Test Location |
| ✅ Free to use | ❌ No Batch Testing |
| ✅ Unlimited Testing | ❌ No Alerts |
| ❌ No Waterfall | |
| ❌ No Advance Test Options | |
| ❌ No Video Capture | |
| ❌ No Resource Graphs | |
| ❌ No side-by-side comparison | |
| ❌ Inaccurate results |