23 Web Performance Mistakes to Avoid in 2024

Every once in a while, we come across new techniques to improve Web Performance.
Some of the techniques are built natively into the browser, such as Lazy Loading or Priority Hints while we have to hack our way through others such as Delaying JavaScript Files until User Interaction.
As Web Performance continues to become a crucial aspect of User Experience, conversion rates, and search engine rankings, it gets important to keep a track of the latest developments in #WebPerf.
Today, we will be looking at various Web Performance mistakes that you need to avoid in order to achieve that perfect score.
Not Enabling HTTP/2 and HTTP/3
If your website doesn’t support modern HTTP standards yet, it’s time for an upgrade. Most modern websites already support HTTP/2 and you can easily check the same using the Response Version of a request on the Waterfall chart on SpeedVitals.
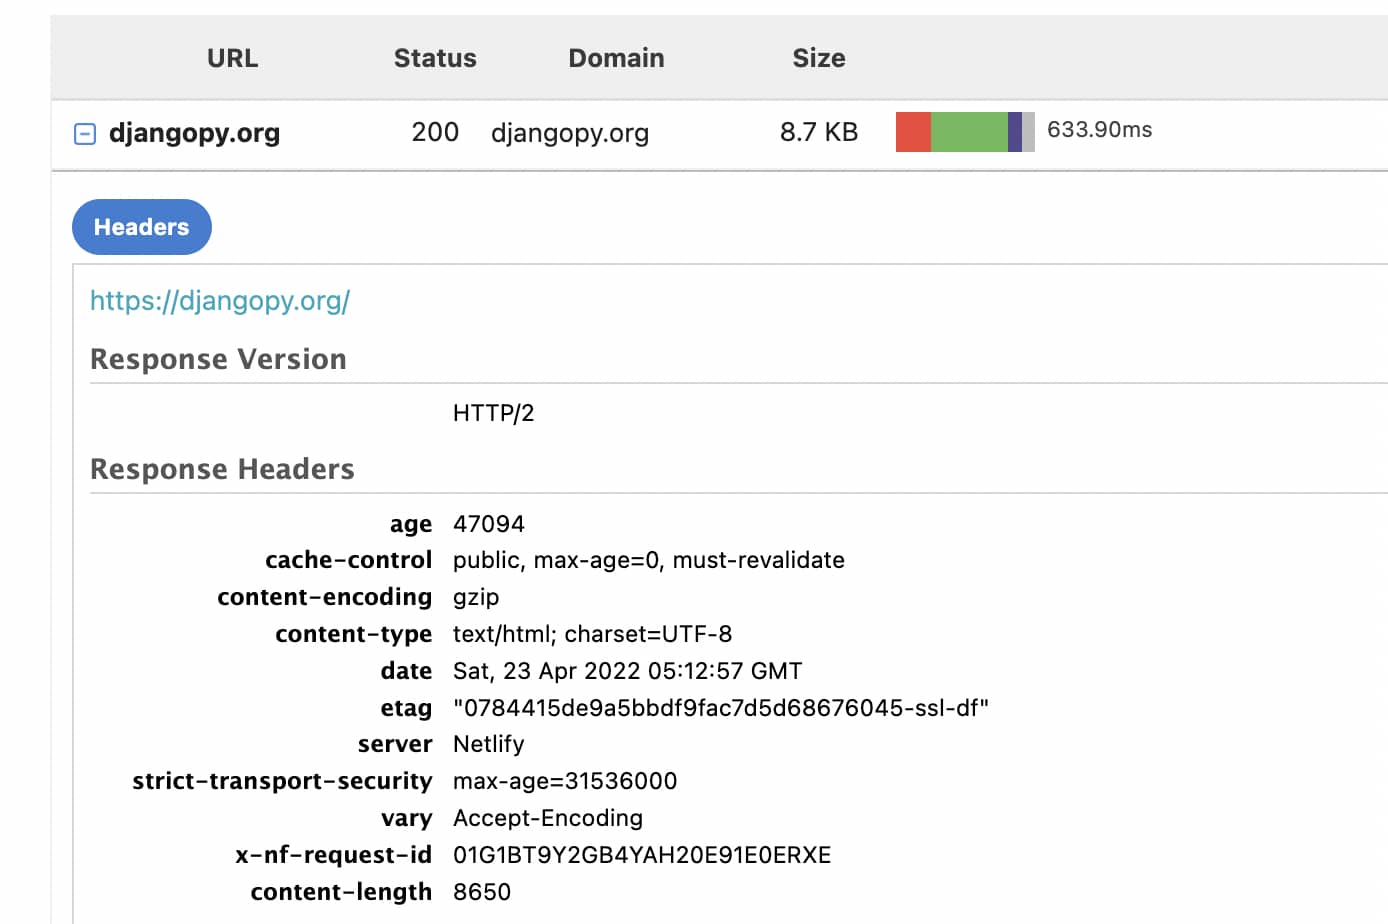
HTTP/2 has various performance advantages and one of the major ones is the ability to send multiple requests in parallel over a single TCP connection. This feature eliminates the requirement of combining CSS & JavaScript files as we did earlier in HTTP/1. You can learn all the advantages of HTTP/2 here.
TIP
You can compare the difference in HTTP/1 and HTTP/2 Performance of a Website by visiting SpeedVitals.com, clicking More Options button, and choosing HTTP Version from the dropdown.
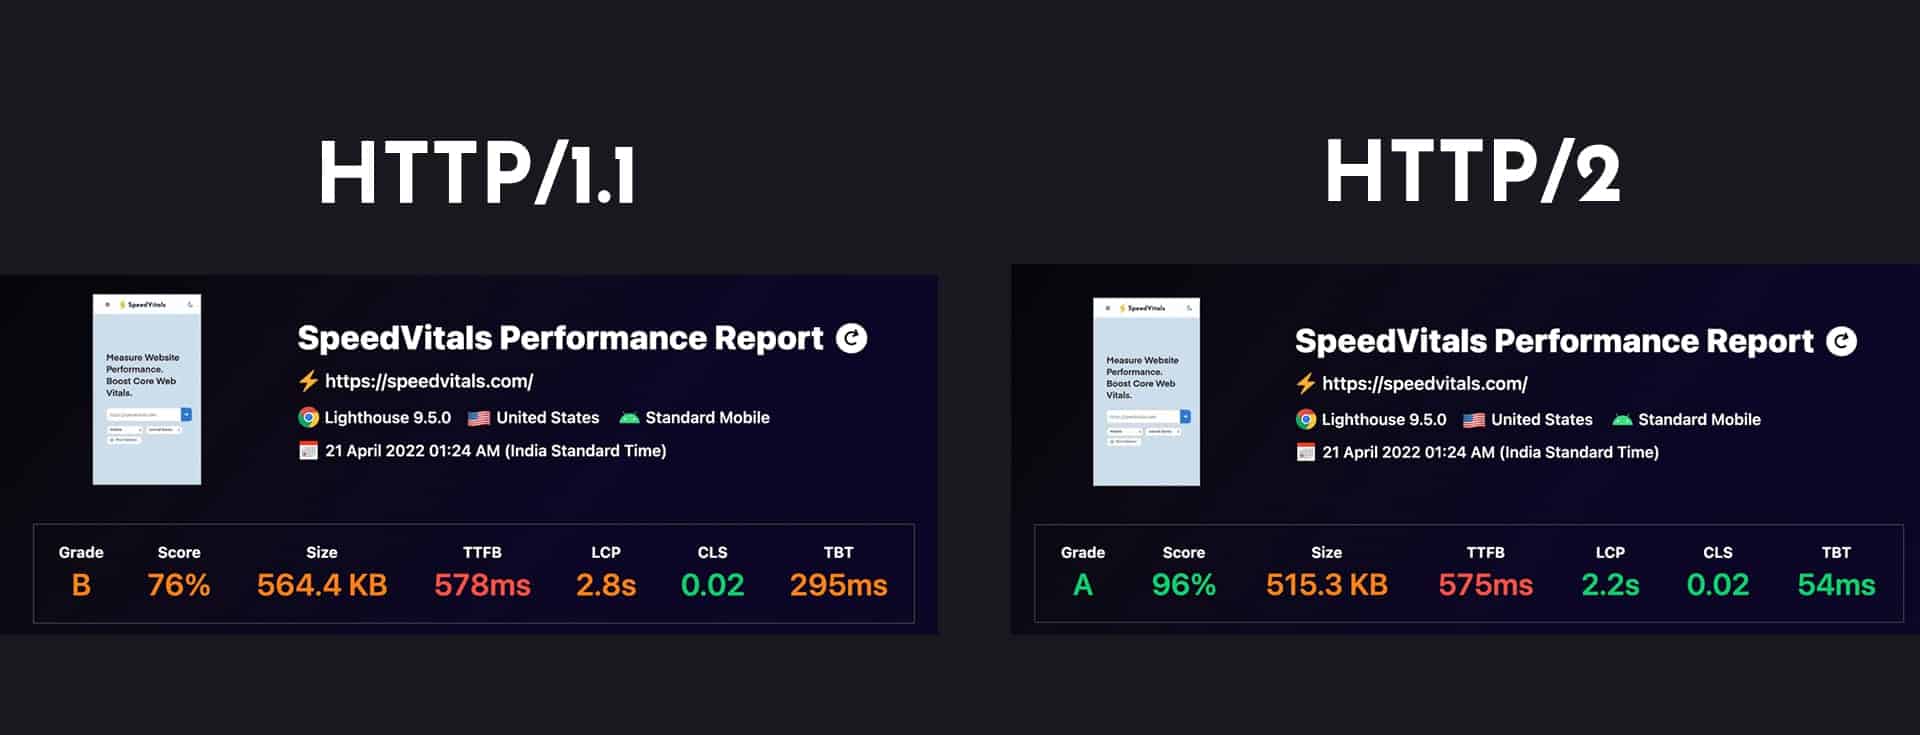
HTTP/3 is still in an early stage but it offers various performance benefits that you shouldn’t miss out on. Here’s a detailed article by Cloudflare on various performance benefits of HTTP/3.
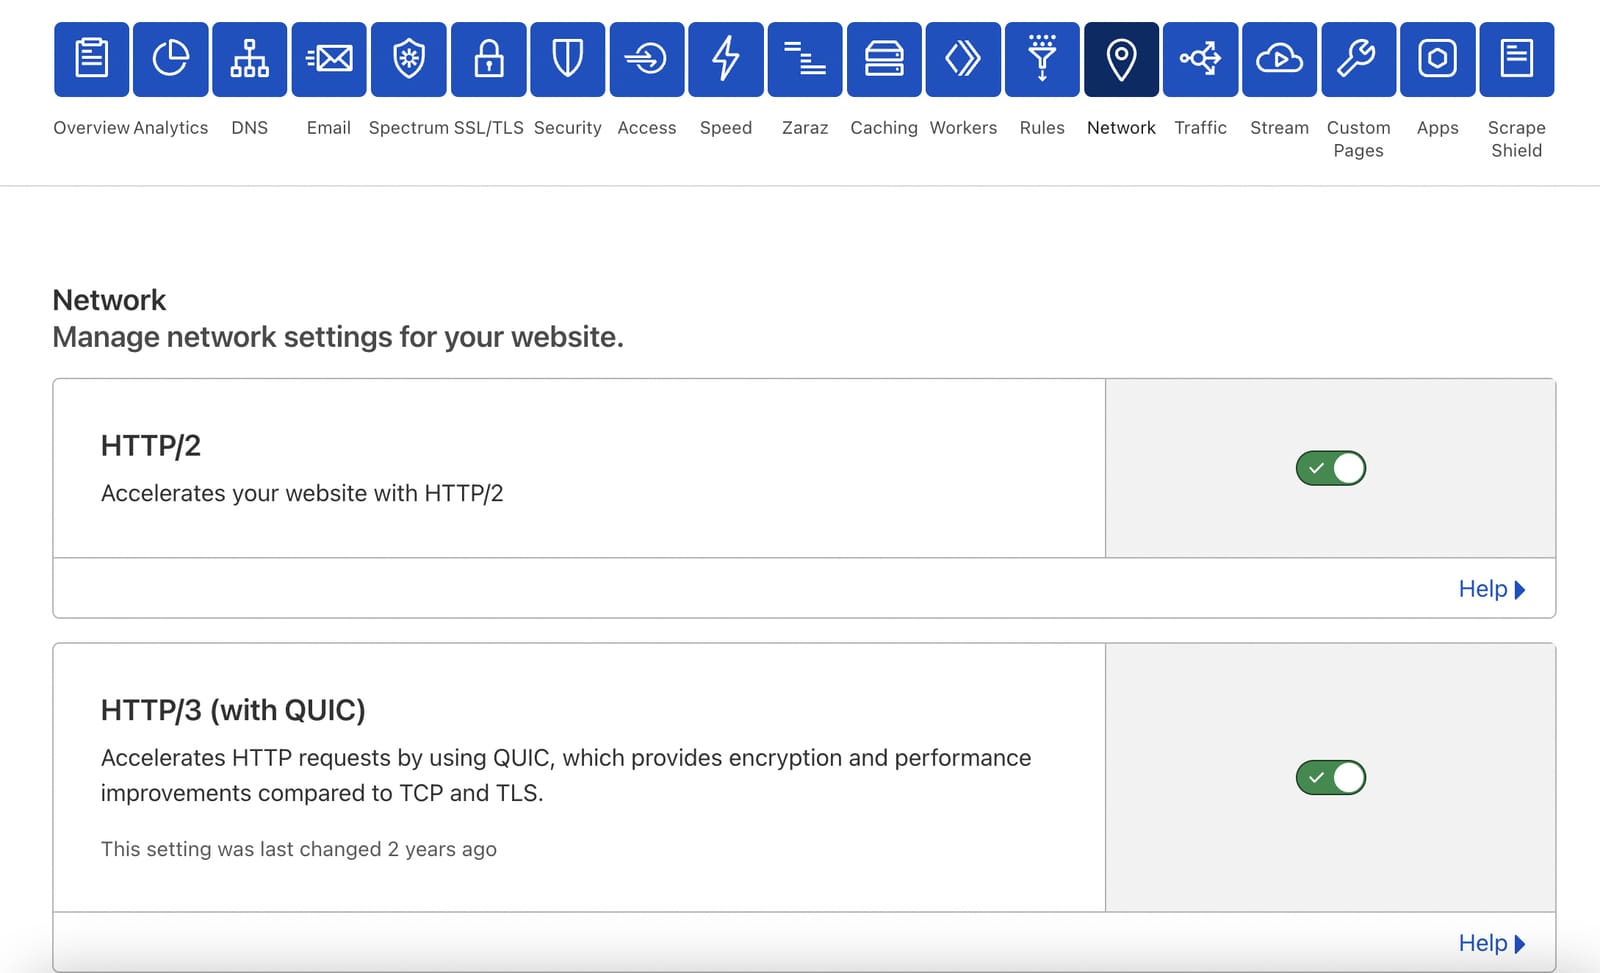
If you use Cloudflare, you can enable both HTTP/2 and HTTP/3 with a single click under the Network Tab on the Website Dashboard.
Not Explicitly Mentioning Image Size in HTML Image Tag
Why mention the image size inside the image tag when we can simply do that via CSS?
Well, if we explicitly mention the image width and height inside the HTML Tag, the browser reserves space for it while rendering the page and that prevents layout shifts.
<img src="random-image.png" alt="Random Image" width="1920px" height="1080px"/>
The best practice is to mention the image width and height in HTML as well as the aspect ratio in CSS.
img {
  aspect-ratio: attribute(width) / attribute(height);
}
If you’re a WordPress user, there are various Performance Optimization Plugins such as WP-Rocket & Flying Press that can automatically add the missing image dimensions.
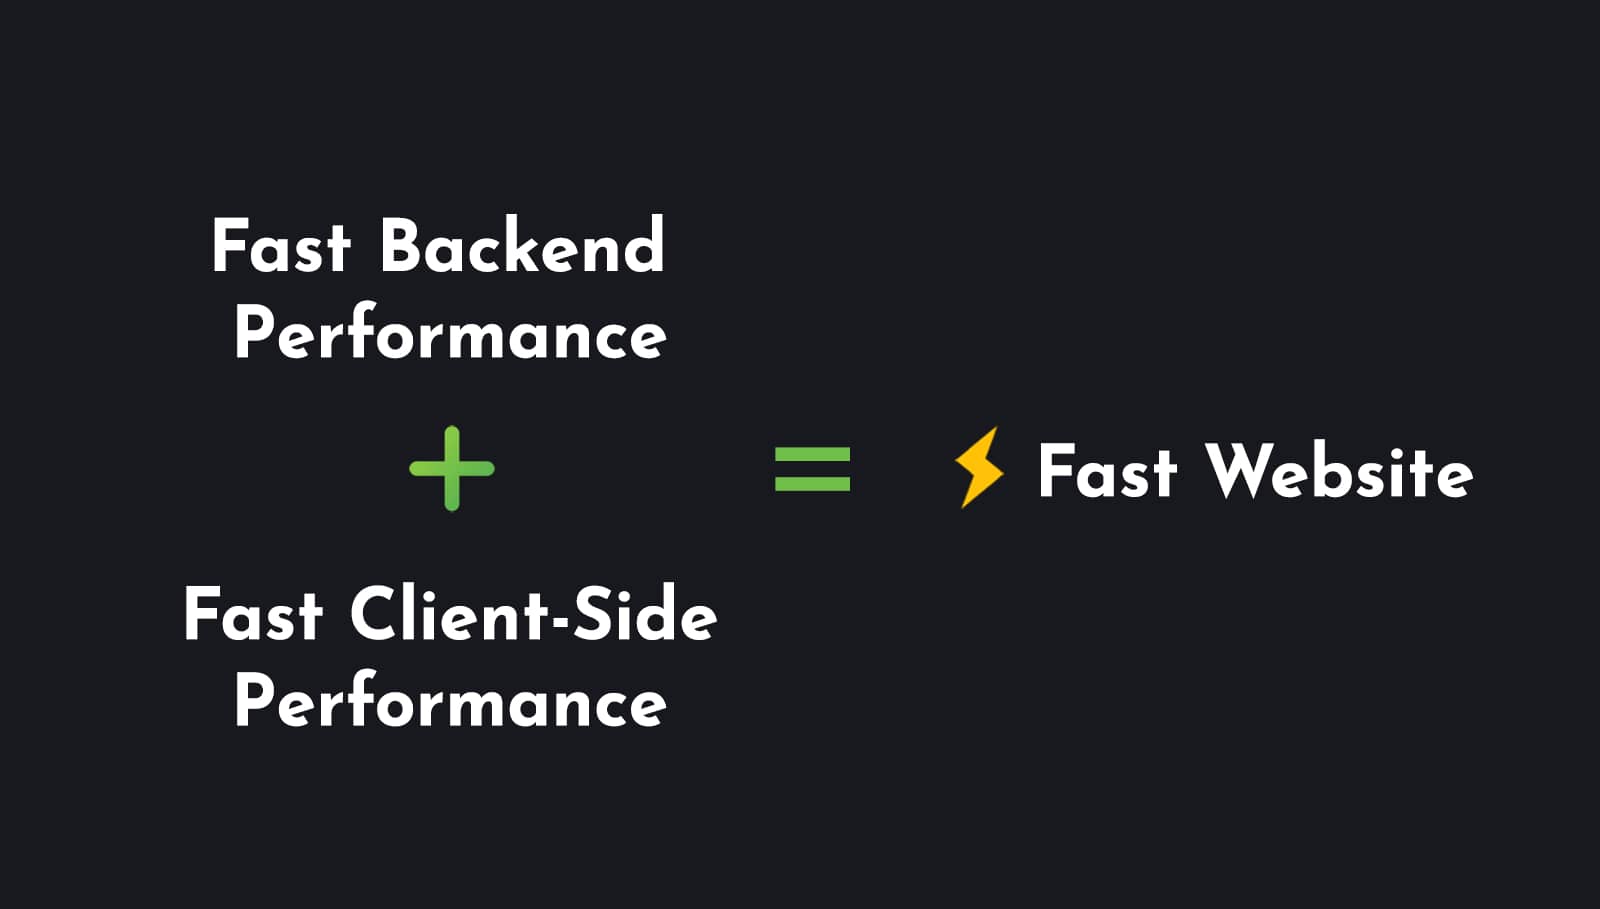
Assuming that a Fast Server/Hosting will Compensate for Poor Client-side Performance
While a Fast Server or Hosting (or a Fast Backend with proper Caching) will result in a performance boost, it won’t help if the Client-side code is a mess.
Even Static Sites hosted on platforms such as Netlify or Cloudflare Pages can have poor performance if they’re not well optimized.
Server-side and Client-side Performance go hand in hand. Either can drag down the overall performance.
I’ve seen countless Website Owners jumping from one hosting or Cloud Provider to another every few weeks in the hope that somehow this new service will magically make their website lightning fast.
Switching to a better Host will only help if the hardware resources are causing a bottleneck resulting in a high Server Response Time or if it is unable to handle a high number of concurrent users.
This is even more applicable to CMS such as WordPress where most of the performance issues are a result of having a high number of unoptimized plugins that enqueue a lot of unnecessary code, stylesheets, and font files to the front-end. In fact, some of those plugins inject their code on pages where the plugin isn’t even required.
Hence, it is crucial to pay attention to both Client-side and Server-side performance.
Combining CSS/JS Files with HTTP/2
With HTTP/1.1, combining the CSS and JavaScript files significantly helped with the performance as it reduced the number of requests a browser had to make to the server.
However, with HTTP/2, it is possible to send multiple requests in parallel over a single TCP connection. Hence, Combining CSS and JavaScript files is no longer required.
In fact, in some cases, combining files with HTTP/2 can even degrade the performance.
While I still recommend reducing the overall number of requests and combining some of the smaller files into one, I don’t recommend combining all the stylesheets, scripts, and icons into a single file for each category.
By having a few very big files, you also run into the risk of render-blocking issues that can hamper the performance.
You can learn more about best Web Performance practices for HTTP/2 on this blog post by Cloudflare.
Not using Modern Image Formats & Compression Techniques
Large and unoptimized images are another big culprit for poor client-side performance. Modern image formats and lazy loading have almost made this problem non-existent.
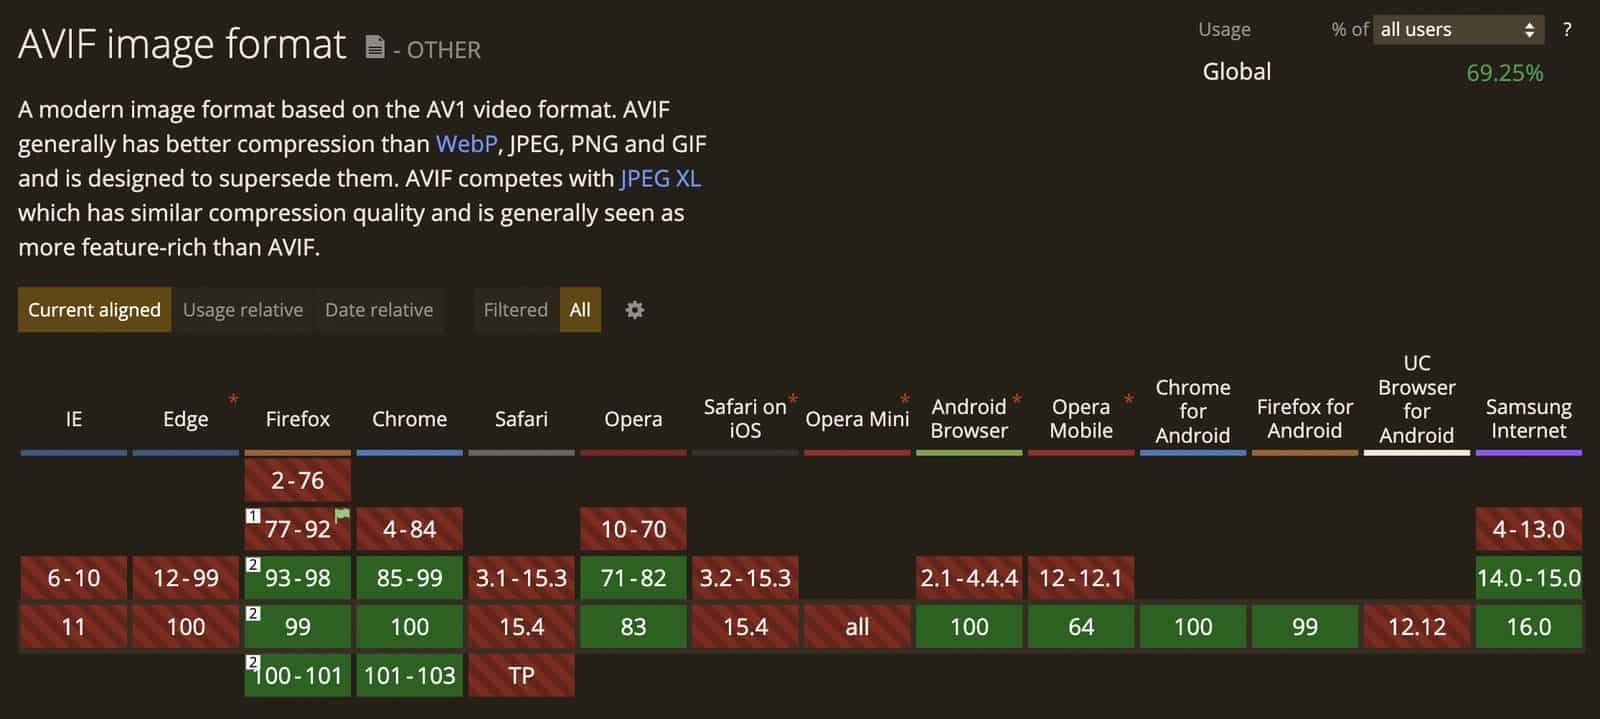
We recommend switching to WebP or AVIF Formats. However, both these formats are still not as widely supported and you’ll need to add a fallback for older browsers.
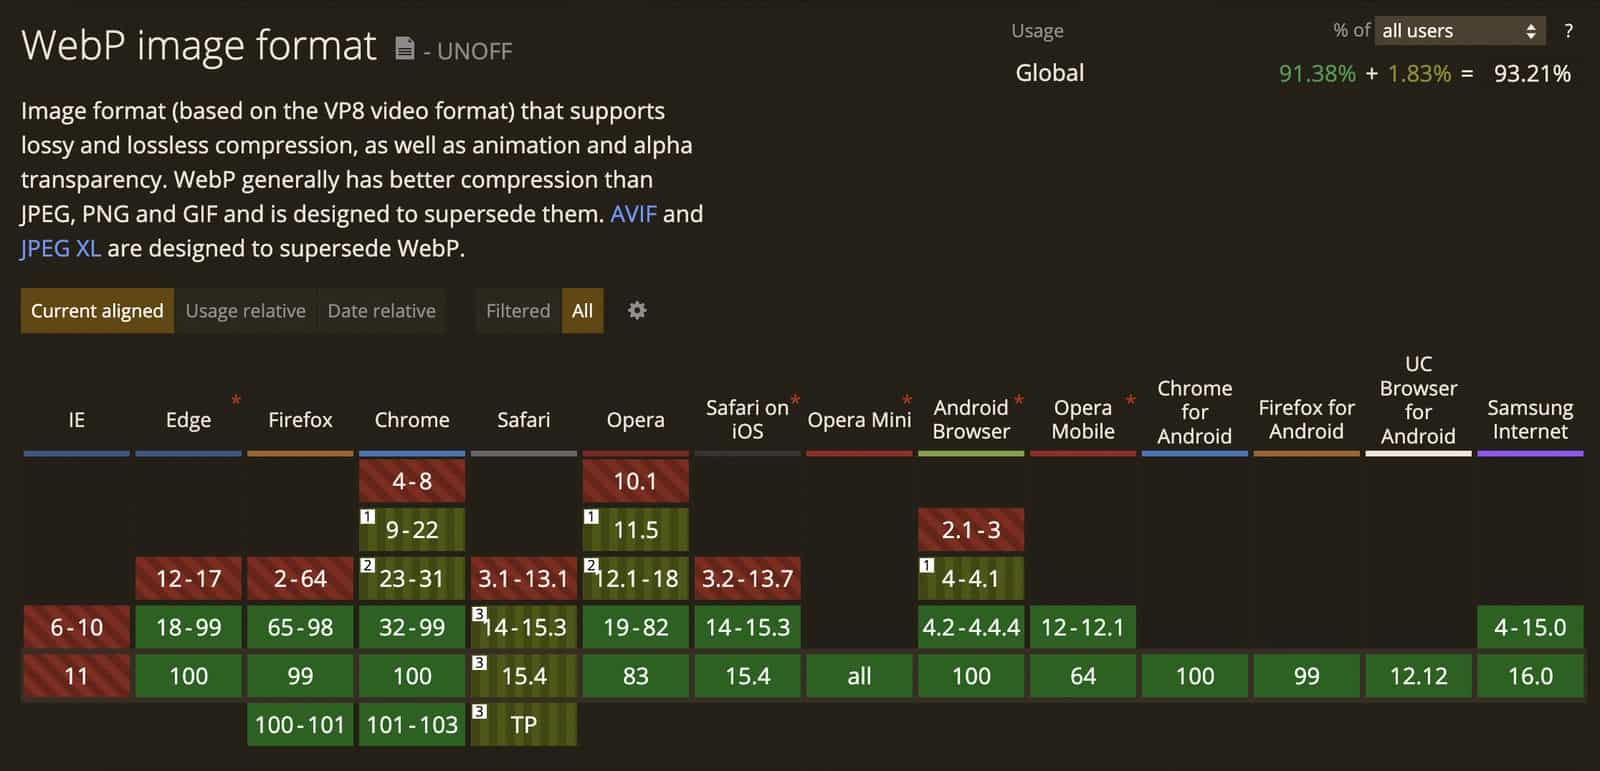
At the time of writing this article, WebP is supported by 93.21% while AVIF support is much lower at 69.25%.
To compress your images, you can use various online tools such as TinyPNG, toolur, or Squoosh.
If you’re a WordPress user who uses some Plugin to compress images, I’ll still recommend uploading images that were optimized beforehand.
Not Hosting Google Fonts Locally
While some articles and experts may argue that as most of the sites on the Internet uses Google Fonts, it would likely be cached in the User’s Browser, and the fact that Google’s CDN is the fastest way to deliver Google Fonts.
However, this argument has already been proven wrong time and time again. Performance comparisons clearly show that Hosting Google Fonts locally results in a significantly better performance. You can learn about the same in this article by WP Speed Matters.
In short, Browsers have a concept called Cache Partitioning. A resource that was cached for one website won’t be available for another website even if it is on the same URL.
Furthermore, Self-Hosting Google Fonts doesn’t require establishing a new connection to Google CDN and the files can simply be downloaded from the existing connection (to your origin server or to your CDN).
The same rule applies to other Font & Icon Libraries as well. You should also Self-Host all the other Third-Party Fonts and Icon libraries such as Font Awesome.
Loading CSS & JS Frameworks/Libraries via their CDNs
One of the biggest Client-side Performance mistakes you can make is by loading the major Frameworks/Libraries such as Bootstrap or JQuery through their respective CDNs.
As discussed in the previous section, the concept called Cache Partitioning comes into play here. Furthermore, establishing connections with multiple origins through the initial stage of page load is a major performance killer.
If you’ll compare the Waterfall Charts of third-way resources loaded externally with Self-hosted ones, you’ll observe significant blocking time in the ones loaded externally.
Instead, you should deliver the critical files through your origin server or your CDN Provider. The less number of origins/CDNs you need to connect to deliver a single website, the better.
Not using Responsive Images
Responsive Images allow you to deliver a different image size based on the viewport size. Using the scrset attribute, you can add multiple images inside a single image tag, and based on the device’s viewport width, the browser determines the appropriate size it needs to deliver.
Hence, instead of ultra-compressing an image that would look subpar on a 4K Display, you can add separate images for mobile devices, tablets, HD, and 4K Displays. This significantly saves bandwidth and improves performance on smaller devices.
Here’s an example of the usage of Responsive Images.
<img src="small-image.png"
sizes="(max-width: 1600px) 100vw, 1600px"
srcset="small-image.png 600w, medium-image.png 1200w, large-image.png 1600w"
width="1600" height="900" />
You can learn more about Responsive Images here.
Over Utilizing Preloading
While Preloading critical resources such as the ones necessary for the first paint as well as the LCP Element can have significant performance improvement, preloading the wrong resource can make it counterintuitive.
Preloading the wrong resource can end up deprioritizing other critical resources and increase the page’s blocking time.
Here’s an example of preloading. The preload tag is usually placed inside the Head Tag.
<link rel="preload" as="image" href="image.png" />
Google recommends using preload sparingly and they have a proper guide over at web.dev to utilize Preloading effectively.
Making Resources Render Blocking
To prevent CSS & JavaScript from blocking the page rendering until they’re loaded & executed, we need to make them load asynchronously or defer it to execute only after the page load finishes.
A JavaScript file can be made non-blocking by adding either the async or defer attribute (or both).
<script async src="script.js"></script>
<script defer src="script.js"></script>
Similarly, a CSS file can be made non-blocking by replacing your link tag with the example below.
<link rel="preload" href="style.css" as="style" onload="this.rel='stylesheet'">
Not Removing Unused Icons from Font Files
This is one of the biggest mistakes Web Developers make and it is a big performance killer. For using just a couple of icons from a font library such as Font Awesome, you don’t need to include the entire library.
Most websites load Icon libraries worth 100’s of KBs while they’re only using Icons that barely require 5-10 KBs.
This problem gets even worse in the case of WordPress where different plugin developers include different types of Font Libraries (including a different version of the same library).
So, what’s the solution?
One solution is to either manually or programmatically remove the unused icons from the font files. Alternatively, you can use Icon libraries that allow selecting specific icons and building the font file accordingly.
Fontello is the perfect solution that allows you to build custom font files from various different icon libraries into a single one.
Not Reserving Space for Dynamic Content
Dynamic Content that gets injected after the initial render of the page is prone to cause Layout Shifts. Advertisements are some of the biggest culprits.
To avoid the layout shift, you need to reserve empty space where the element will be rendered.
Here’s an example of reserving space for an Ad of size 300 x 200 px:
<div id="ad-container" style="min-width: 300px; min-height: 250px;"></div>
To learn more about reserving space for Google Adsense, check out this guide by Google.
Not Delaying Low Priority JavaScript Files Until User Interaction
Delaying the loading and execution of low-priority JavaScript is my #1 Web Performance hack that can make almost every JavaScript-heavy Web Page lightning fast.
To implement this technique on your website, we have an in-depth guide that you can follow. If your website is on WordPress, you can use the Flying Scripts plugin to implement the same.
We recommend delaying the following scripts until user interaction:
- Ads (Google Adsense)
- Tracking/Analytics Scripts (Google Analytics, Facebook Pixel, Hotjar)
- Cookie Notices
- Captchas
- Google Maps
- Comments (Disqus, Facebook Comments)
- Customer Support and Live Chat Plugins
- All the other JavaScript files that are not required until user interaction
Not Utilizing Lazy Loading Effectively
Lazy Loading is a super-effective way to improve Web Performance that can not only be used for Images but also for videos, embeds (Youtube/Vimeo), and iFrames.
To implement Lazy Loading, you no longer need to use any Lazy Loading plugins and it is natively supported in most modern browsers.
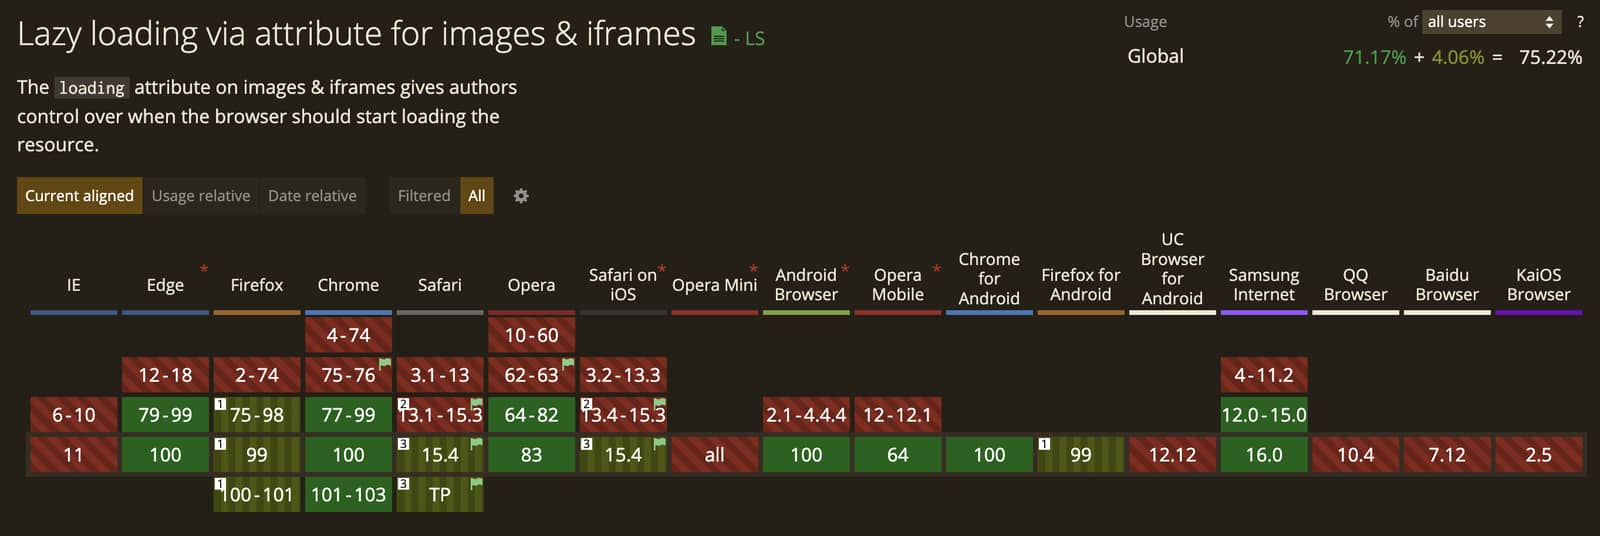
You can enable lazy loading by simply adding the attribute loading=”lazy” to your Image or iFrame tag.
For effective use of Lazy Loading, you should include it on every Image and iFrame that is not present above the fold.
To lazyload a video, add the attribute preload=”none” on the video tag.
Lazy Loading LCP Image
While lazyloading gives a big performance boost, it can actually cause your Web Vitals scores to dip if you lazy load the Largest Contentful Element of the viewport (which is usually an image for most websites).
To ensure that your LCP Score stays high, you need to double-check and make sure that you aren’t lazy loading the LCP Image (or a video/iFrame).
Similarly, don’t lazy load any other above-the-fold Images as it can dip your performance scores both in the lab environment as well as in the Field.
Not Offloading Third-Party Code from Main Thread to Web Workers
If for some reason it is not possible to Delay the third-party code until user interaction, the next best thing you can do is offload it to a Web Worker. You can even combine both techniques!
This in turn helps run your website’s code on the main thread while all the third-party code is executed through a Web Worker. Here’s an image that illustrates the same.
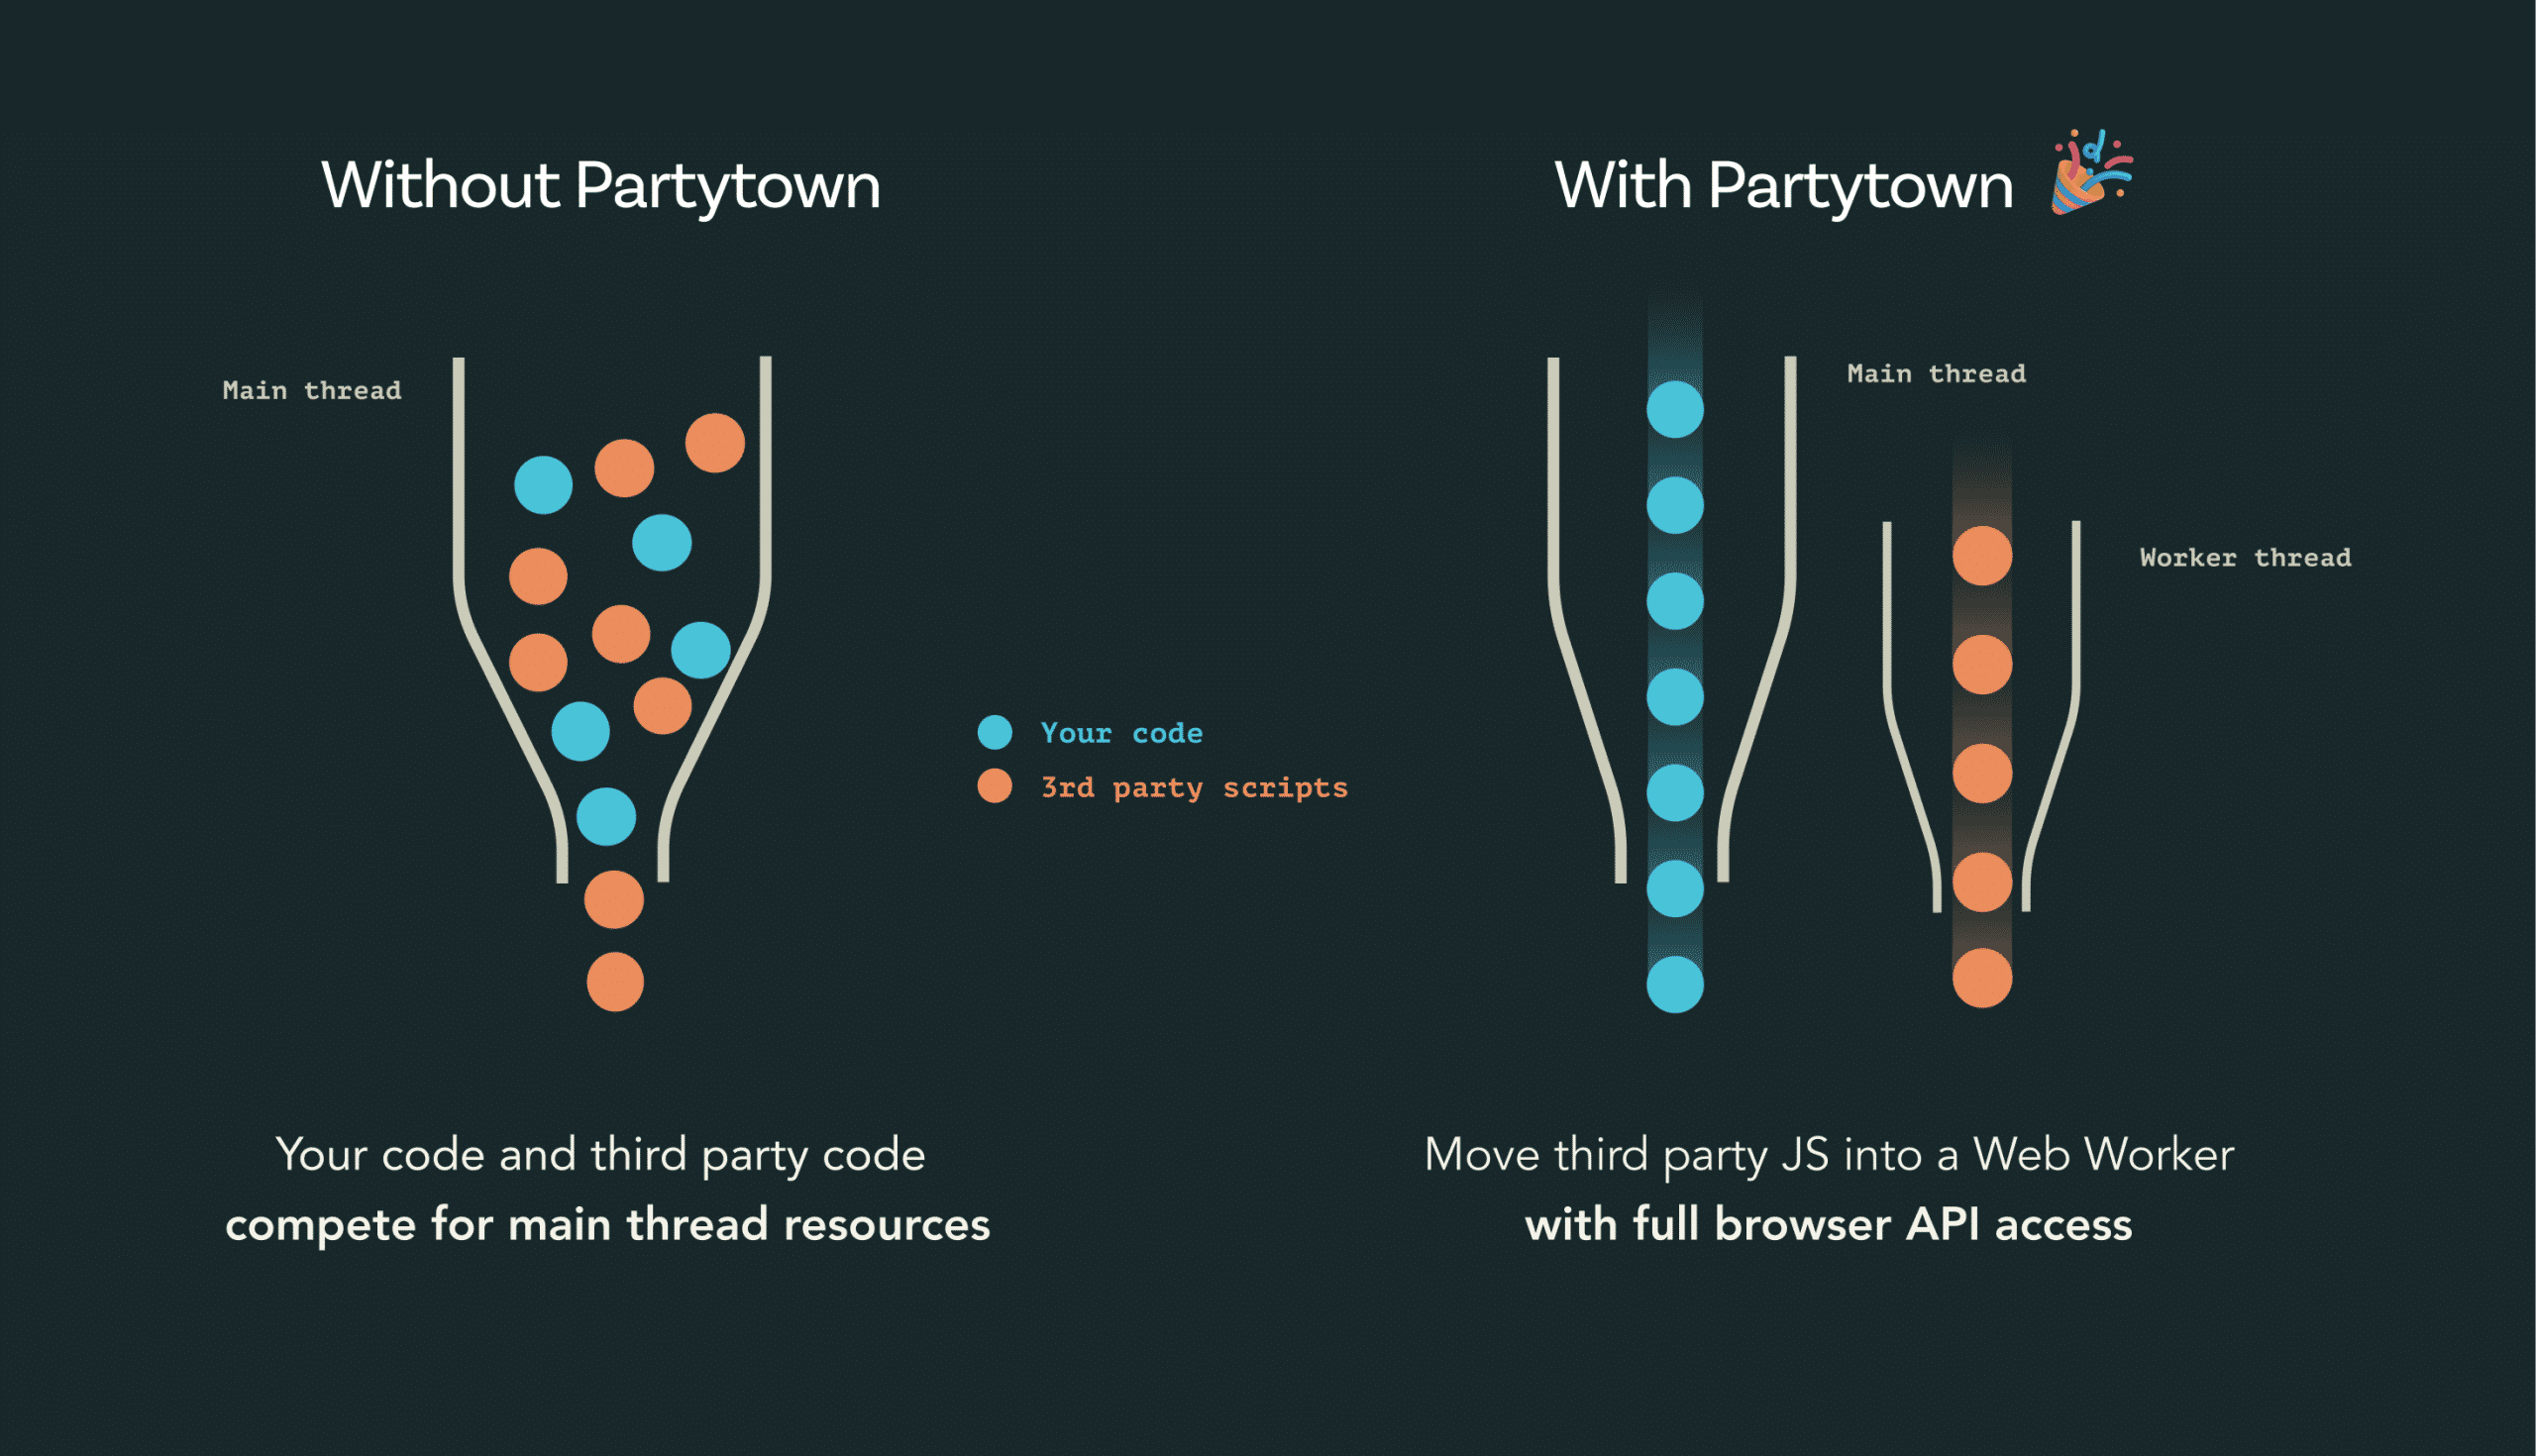
Image Credits: Partytown (Builder.io)
Partytown by Builder.io and Cloudflare Zaraz are two tools/services that you should check out to get started with the same.
Not utilizing Early Hints
Early Hints or the HTTP Status Code 103 as the name suggests gives a very early hint to the browser about what resources it is supposed to preload.
The Status Code 103 is sent even before the 200 response code!
This in turn helps load the critical resources much earlier and significantly boosts the page load time. Here’s a guide that you should check out to understand Early Hints better.
Here’s an illustration by Cloudflare on how Early Hints work:
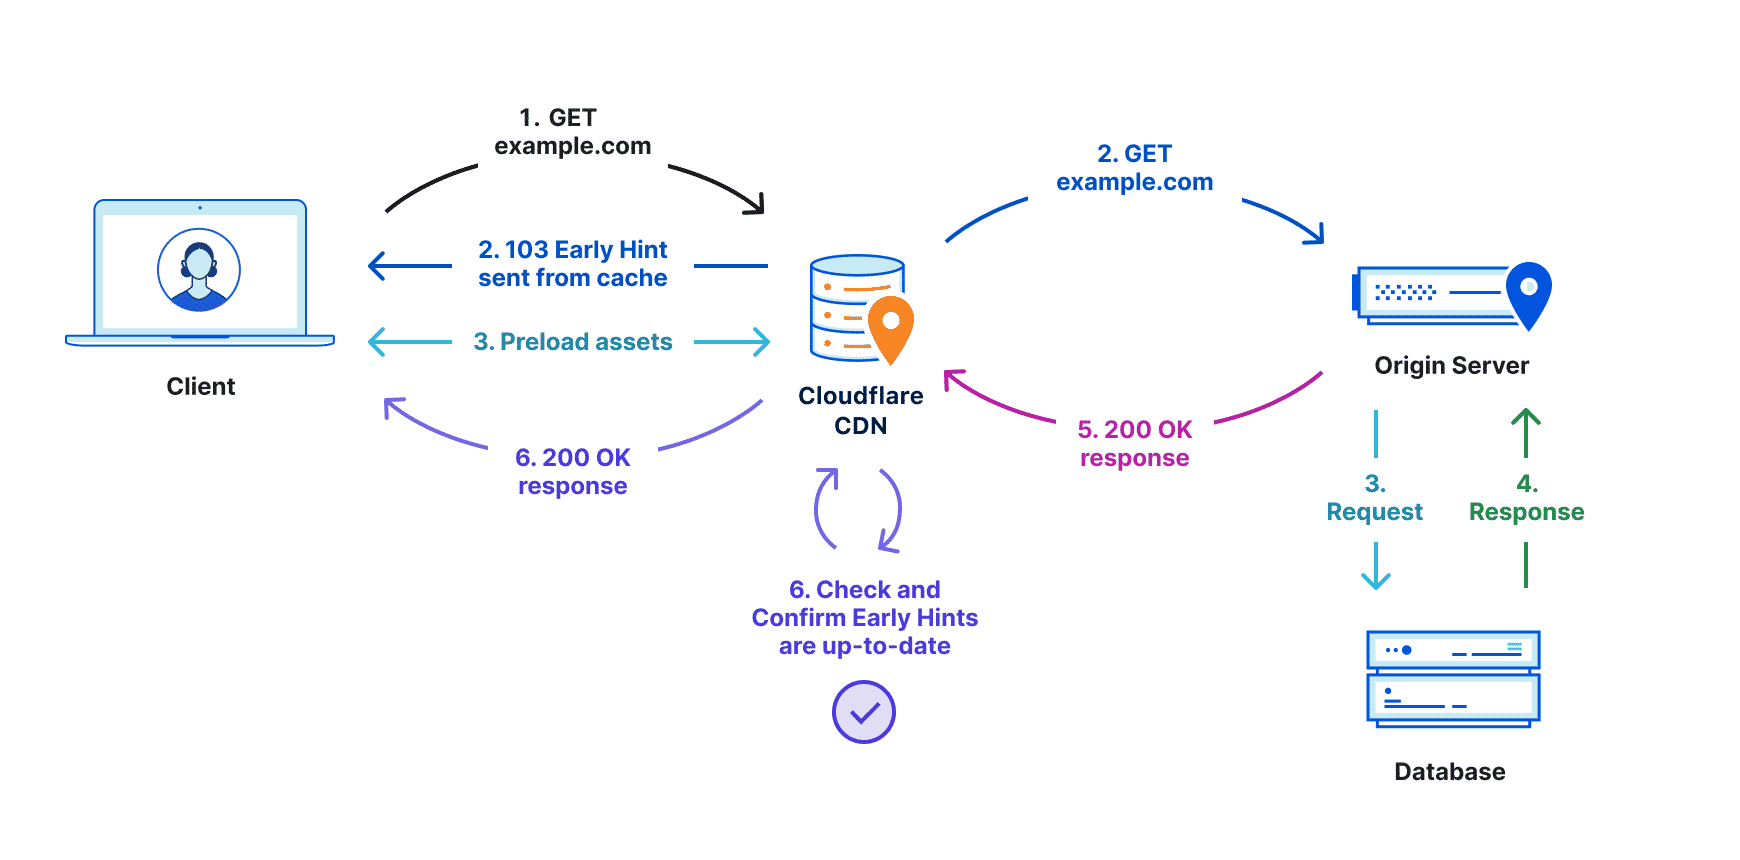 Image Credits: Cloudflare
If you’re a Cloudflare user, you can enable Early Hints with a single click on the Speed -> Optimization section of your website’s dashboard.
Not Removing Unused CSS & JavaScript Code
A lot of websites load their entirety CSS & JavaScript code on every single page instead of loading them selectively per-page basis.
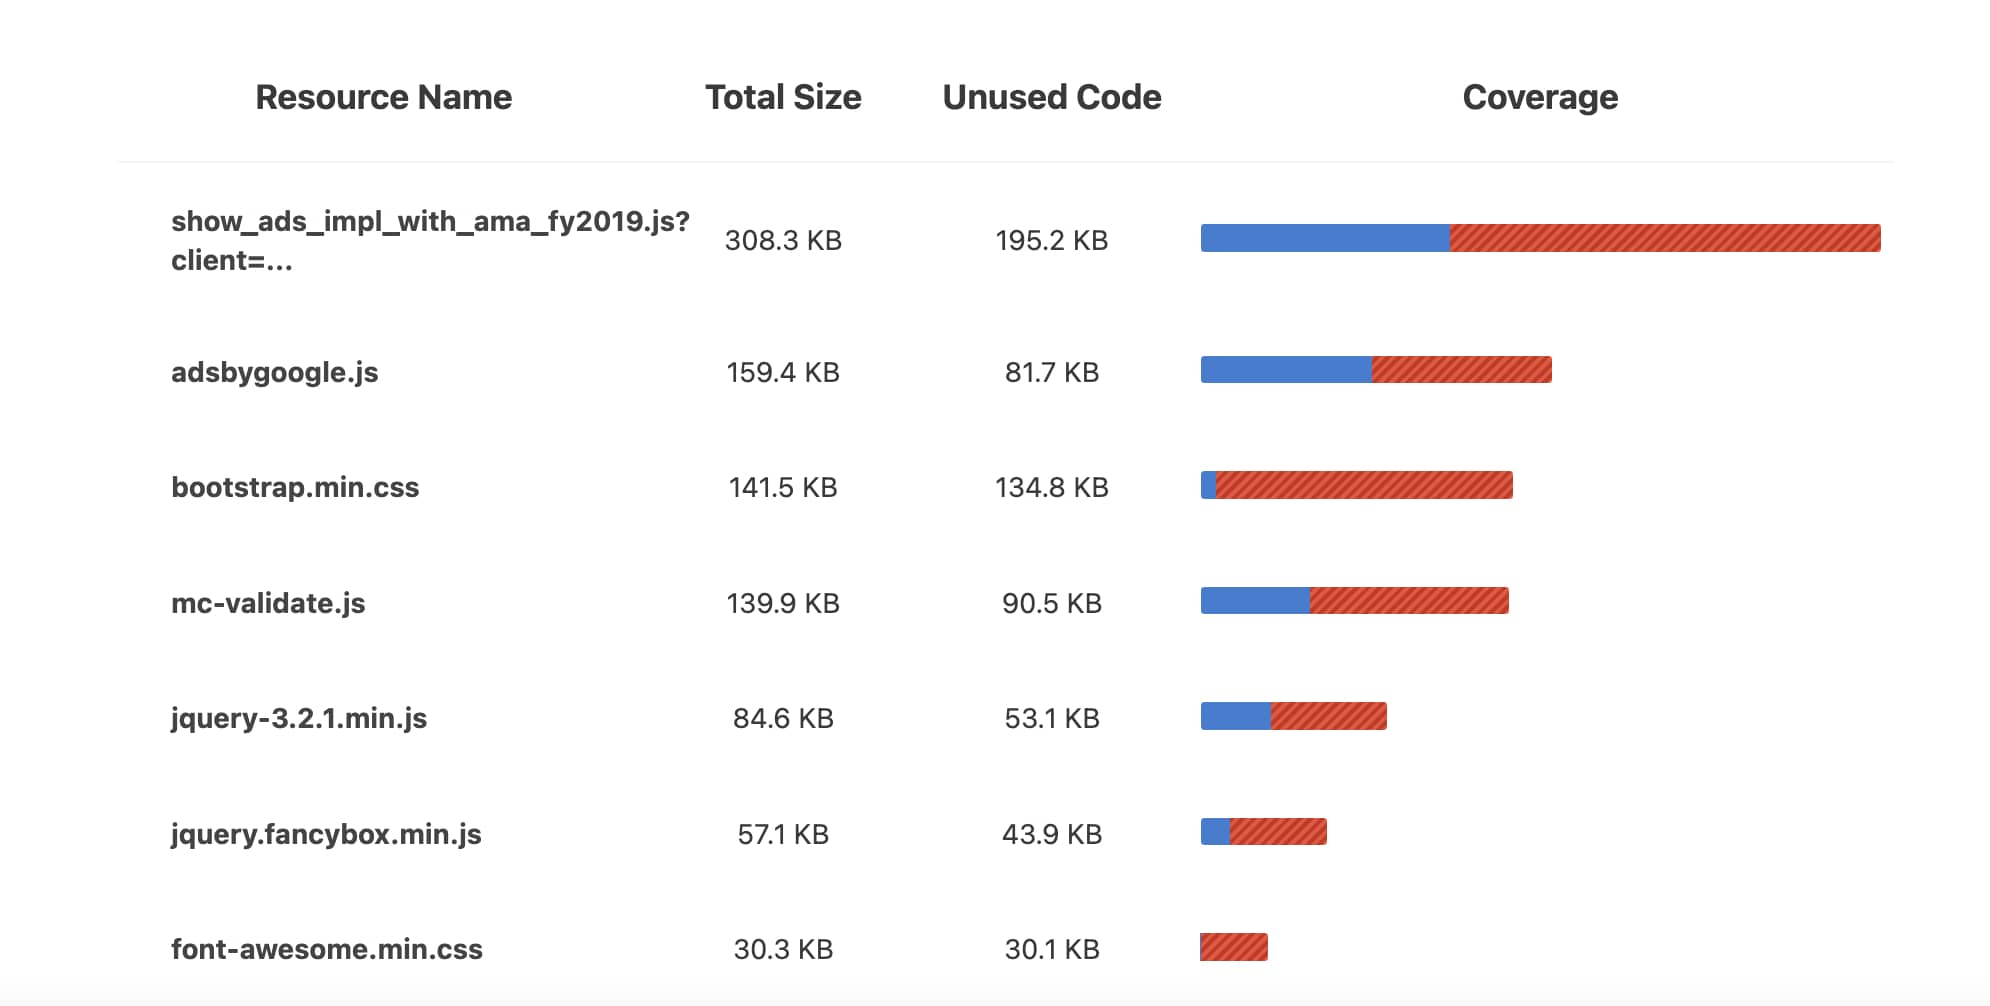
As a website size gets larger, most of its pages are barely using any of the CSS and JavaScript code. Web Pages end up loading MB’s worth of data when barely a few hundred KBs are actually required. Loading any extra code that is not required is only going to hamper the performance.
To tackle this problem, it is important to track the Code Coverage and remove the unused code segments. Removing unused code is not only going to improve the performance and reduce the bandwidth usage, but it will also directly help reduce your website’s carbon footprint.
SpeedVitals has a Code Coverage section that can help you identify files that are barely being used on the page.
Not Submitting Site for HSTS Preloading
HSTS stands for Strict-Transport-Security and it is a response header that indicates that a website can only be accessed with HTTPS enabled. This helps prevent the man-in-the-middle attack.
But HSTS can also help improve the website performance by submitting your website to Google Chrome’s HSTS Preload list. Most of the other major browsers including Firefox, Safari, Opera, and Microsoft Edge also use Chrome’s Preload list so you only have to submit your website at one location.
Once a website makes it into the HSTS Preload list, the browsers will automatically connect to the HTTPS version of the site. When a user opens your website without HTTPS, instead of first making an HTTP request, it will automatically redirect to the HTTPS version.
Here’s an example of the Response header you need before submitting the site on the HSTS Preload list:
Strict-Transport-Security: max-age=31536000; includeSubDomains; preload
If you’re a Cloudflare user, you can easily set this header using this guide. Make sure to Turn On the preload option.
Ignoring Server Response Times
I’ve always emphasized that server response time or TTFB is one of the most important metrics in Web Performance.
A high server response time will add up extra time to the rest of the performance metrics including Web Vitals such as FCP and LCP.
For example, if a website has a TTFB of 1 second and LCP of 3.5 Seconds, cutting down the TTFB to 200 ms will bring the LCP to 2.7 seconds without making any change on the client-side!
A slow response time is either due to a slow backend or high network latency (or a combination of both). We have an extremely detailed guide on reducing server response times that you should check out!
Using JavaScript for Features Supported Natively in HTML & CSS
One of the secrets to great client-side performance is the minimal use of JavaScript. You’ll be surprised to know the number of things you can do just with HTML and CSS!
Some of the features you can implement without JavaScript include but are not limited to:
- Dark Mode
- Form Submission
- Popovers
- Cookie Notices
- Filters
- Comparison Sliders
- Carousels
- Sidebars
- Parallax Effect
- Gradient Animations
- Lightbox
Whenever you’re adding a new feature on the site, first check if it can be implemented without JavaScript.
If JavaScript is a must for a certain feature, try coding your own solution and look for examples online and try your best to avoid solutions that require adding a third-party library for a simple task.
Not Utilizing Full Page Caching (HTML Caching)
Full Page Caching or HTML Caching can give a significant performance boost when the Server-side performance is the culprit.
A CDN can deliver the Fully Cached version of your website across the globe with response times under 200ms. This is especially useful when a website has users from different regions across the globe.
Our article on Reducing Server Response Time also talks about Full Page Caching in-depth. You can go through the article to understand whether your site is eligible for HTML Caching.
Services like Netlify and Cloudflare Pages can host your Static Site for free and deliver it across the world at lightning-fast speeds with the help of their Edge Networks. We also have a comparison on Cloudflare Pages & Netlify that you can check out.
Not Monitoring Performance Regularly
Optimizing Web Performance is not a one-time process (unless you stop making any changes to the site).
Every small change you make can have either a positive or negative impact on performance and monitoring the same is crucial to ensure your website remains fast.
Monitoring gets even more important with Google’s Core Web Vitals update as it relies on real-world data that is continuously updated. With Web Performance Monitoring, you can detect and fix issues way before your URLs fall into the poor category of the Core Web Vitals section in the Google Search Console.
