Website Performance Optimization: What Matters the Most

Whenever you read a website performance optimization checklist, you'll usually find 30 or 40 tips listed as if they carry equal weight. Minify CSS, enable HTTP/3, self-host Google Fonts, convert images to WebP, add a CDN, and so on.
But a browser doesn't load your page from a checklist. It follows a dependency chain. A 20 KB image saving can't make up for a server that takes one second to send the HTML, and HTTP/3 can't make 700 KB of unnecessary JavaScript cheap to execute.
So which optimizations actually move your Core Web Vitals, and in what order should you make them? Let's find out.
Fix the stages in the order the browser reaches them. Start with server response time and HTML caching, send meaningful HTML instead of an empty app shell, and make the LCP image discoverable with nothing blocking its render. Then cut JavaScript, CSS, image bytes, and third-party scripts. Caching, fonts, INP, and CLS come next, and advanced features such as Speculation Rules and Early Hints come last.
This is a default order for a site that hasn't been optimized systematically, not a law. If your field data shows a 150 ms TTFB and a 600 ms INP, the main-thread work in step 9 should obviously come first.
The ranking is based on how browsers load a page, Google's web.dev guidance, and HTTP Archive's 2025 Web Almanac. We didn't run a new SpeedVitals benchmark for this article, so the numbers come from those public sources unless I mention our own testing.
The Metrics That Matter
The three Core Web Vitals are each assessed at the 75th percentile (p75) of real page loads, separately for mobile and desktop. Time to First Byte (TTFB) isn't a Core Web Vital, but web.dev calls it a foundational metric because it comes before every loading metric.
Here's a table of the "good" thresholds from web.dev, checked in October 2026:
| Metric | What It Measures | Good at p75 | Core Web Vital? |
|---|---|---|---|
| LCP (Largest Contentful Paint) | When the largest visible element renders | 2.5 s or less | ✅ |
| INP (Interaction to Next Paint) | How quickly the page responds visually to clicks, taps, and key presses | 200 ms or less | ✅ |
| CLS (Cumulative Layout Shift) | How much visible content moves unexpectedly | 0.1 or less | ✅ |
| TTFB (Time to First Byte) | How long the browser waits for the first byte of the HTML | 0.8 s or less (a rough guide) | ❌ |
You'll also see First Contentful Paint (FCP) in most tools. It marks the moment the first text or image appears.
The target isn't a 100 score in Lighthouse. A lab run shows what's possible under controlled conditions. Field data shows what your visitors actually got, with their real devices, networks, cookie banners, and third-party scripts.
So use field data to decide what to fix, through CrUX (our Core Web Vitals checker shows it) or real-user monitoring (RUM) on your own site. Then use lab tools such as Lighthouse, Chrome DevTools, and our website speed test to find the cause.
Why the Order Matters
The browser can't render anything until the HTML starts arriving. It can't paint an image-based hero until it discovers and downloads that image, and it can't respond to a tap while the main thread is busy with JavaScript.
Google's LCP guidance makes this chain visible by splitting Largest Contentful Paint into four sequential parts:
- TTFB: the wait for the first byte of the HTML.
- Resource load delay: the gap between TTFB and the start of the LCP resource download.
- Resource load duration: the download time of that resource (usually an image).
- Element render delay: the time between the download finishing and the element painting.
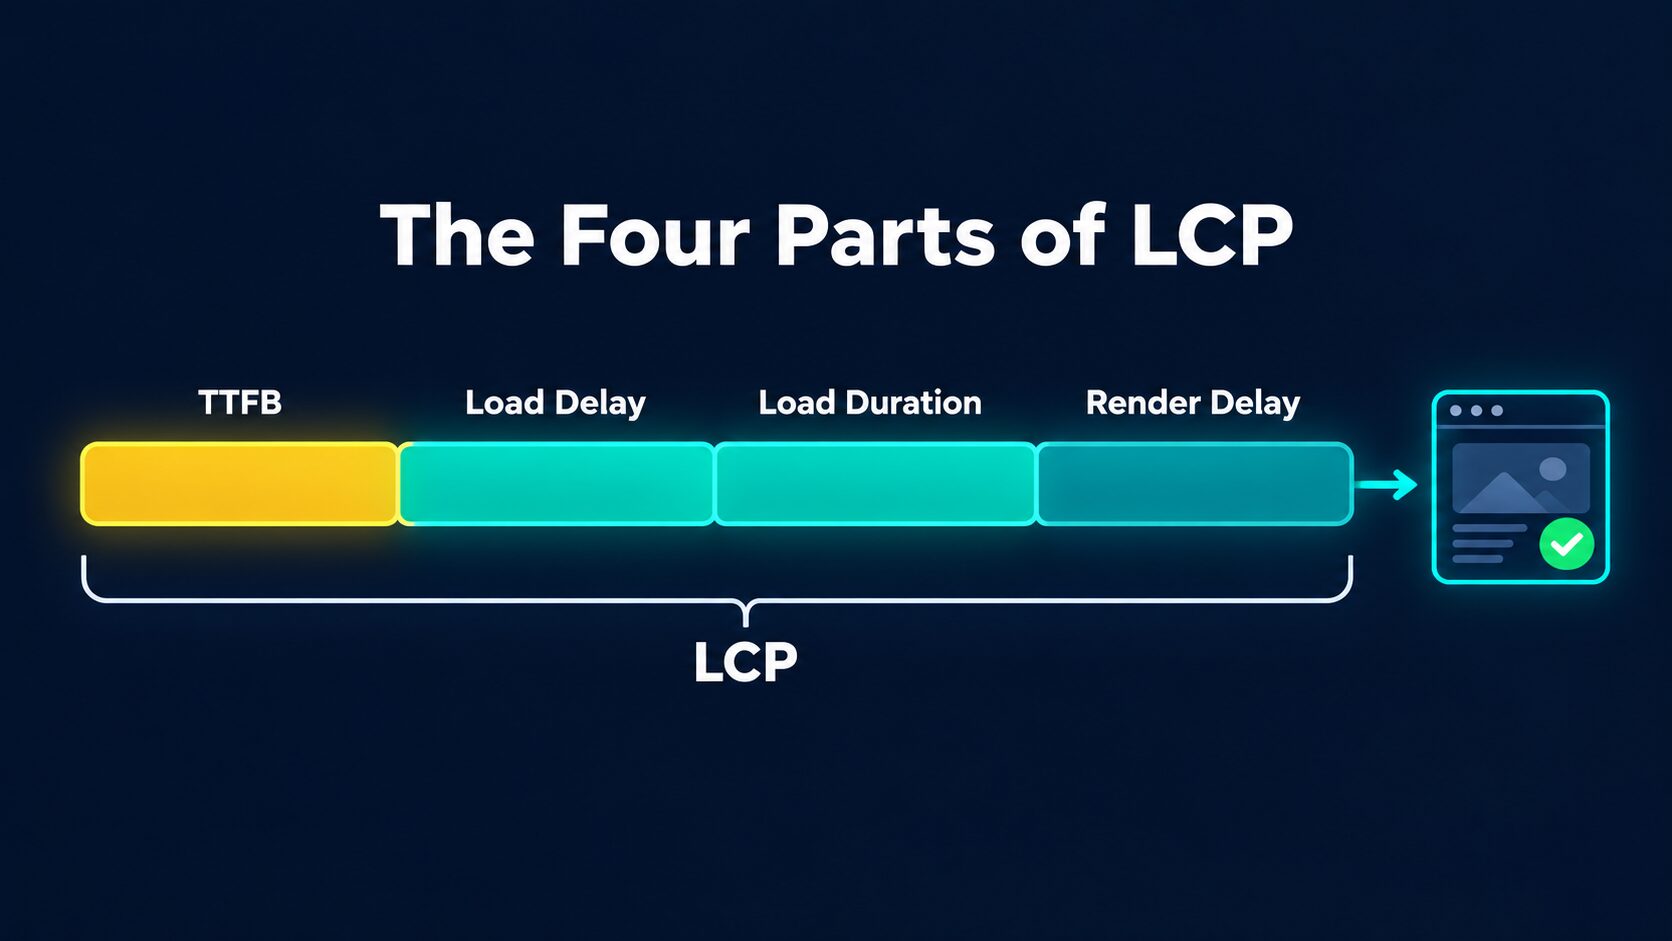
Notice that TTFB sits at the very start of the bar. Nothing on the front end can begin before the HTML arrives, so every millisecond of TTFB ends up inside your LCP.
For example, take a page with a 1.5 s TTFB and a 3.2 s LCP. Cutting the TTFB by 500 ms brings the LCP to roughly 2.7 s when nothing else changes, without touching a single image or script.
HTTP Archive's 2025 Web Almanac shows how many sites still struggle with these basics:
| 2025 Web Almanac Finding | Result |
|---|---|
| Sites passing all Core Web Vitals | 48% (mobile), 56% (desktop) |
| Pages where an image is the LCP element | About 76% (mobile), 85% (desktop) |
| Pages that lazy-load their LCP image | About 16% |
| Median mobile Total Blocking Time | About 1.9 s |
| Mobile pages passing the render-blocking audit | Around 15% |
None of these numbers improves by switching to HTTP/3. They point back to how fast the HTML arrives, how early the browser finds the LCP image, and how much JavaScript the page runs.
Here's the order I'd follow on a site that hasn't been systematically optimized yet:
| Rank | Optimization | Main Metrics It Moves |
|---|---|---|
| 1 | Fast HTML: low TTFB with full-page or edge caching | TTFB, FCP, LCP |
| 2 | Useful HTML that doesn't wait for client-side JavaScript | FCP, LCP, INP |
| 3 | A discoverable, high-priority LCP resource and fewer render blockers | LCP, FCP |
| 4 | Only the JavaScript and CSS the page needs | LCP, INP |
| 5 | Correctly sized and prioritized images | LCP, page weight, CLS |
| 6 | Fewer and delayed third-party scripts | LCP, INP |
| 7 | Long-lived caching, compression, and a CDN | Repeat loads, transfer size |
| 8 | Self-hosted fonts and a smaller font budget | FCP, LCP, CLS |
| 9 | A free main thread for interactions | INP |
| 10 | A stable layout | CLS |
1. Make the HTML Arrive Fast
I've always treated TTFB as the first step of any optimization, and the LCP breakdown shows why. If the browser waits one second for the HTML, every front-end optimization starts one second late.
Web.dev suggests a TTFB of roughly 800 ms or less at p75. Perfectly compressed images won't help if every document request waits 1.5 to 3 seconds on application code, database queries, or a server on another continent.
Cache the Whole Page Where You Can
If a public page shows the same HTML to every visitor, don't rebuild it from the application and database on every request. Serving it from memory or a nearby CDN edge usually removes far more latency than database micro-optimizations.
That can be static HTML generated at build time, a full-page cache at the origin, or HTML cached at a CDN edge. Stale-while-revalidate also helps, since it serves a fresh-enough cached copy while the backend refreshes it. Here's how that usually looks by site type:
| Site Type | What to Cache |
|---|---|
| Static site | Pre-generated HTML served from a CDN edge |
| WordPress or another CMS | A full-page cache for logged-out visitors, bypassed only for personalized areas |
| Ecommerce | Product and category pages where safe, with personalized fragments or API data loaded separately |
| SaaS | Public marketing and docs pages cached heavily, with server tuning saved for logged-in app routes |
Speed Up the Requests You Can't Cache
For pages that genuinely need to be dynamic, profile the server before you pay for a bigger one. Eliminate N+1 database queries, cache expensive database and API results, run independent API calls in parallel, and move work the response doesn't need out of the request path.
Add CPU or memory only when the server is actually saturated. Buying more CPU before checking whether the page can be cached is a classic mistake.
Put the HTML Closer to Your Visitors
A CDN cuts TTFB the most when it caches the document itself, not just your CSS, JavaScript, and images. Without cached HTML, it can still help with TLS and routing in some setups, but it can't erase slow application code at the origin. I've explained this in more detail in my guide on reducing server response time worldwide.
Remove Redirects before the Final Document
Redirect chains are pure latency. HTTP to HTTPS, www to non-www, campaign URLs, and login flows can quietly stack several redirects, and lab tests that start at the final URL never show them. Running your campaign URLs through a redirect tracer shows every hop and its latency.
To check TTFB itself, test from where your visitors are, not from a datacenter next to your server. Our TTFB test measures it from 40 locations in one run (as of October 2026).
2. Send Useful HTML in the First Response
Once the server responds quickly, the next question is what the response contains.
If the server returns a minimal app shell, the browser has to download the JavaScript, parse and run it, fetch data from an API, and build the DOM. Only then does it discover the LCP image or text, so a fast TTFB never turns into a fast page.
For the visible, indexable content of most websites, I recommend an architecture that puts meaningful HTML in the initial response. That can be static generation, server-side rendering (SSR), streamed SSR, progressive enhancement, or island hydration when only a few components need to be interactive.
Changing the rendering approach removes whole stages instead of shaving kilobytes off one file. Text LCP can render as soon as the HTML and CSS allow, and image URLs in src and srcset become visible to the browser's preload scanner right away.
This isn't a framework war. Highly interactive, logged-in apps can justify client-side rendering (CSR). The mistake is making visitors download and run a large client runtime for content that could have arrived as HTML.
However, SSR has a cost too. It adds backend work and can raise TTFB, and swapping a 1.5-second client render for a 1.5-second server render gains you nothing. Cache or prerender the output where you can, and measure the whole path.
My CSR vs SSR for AI SEO article shows what crawlers receive in each case. For an app that has to stay client-rendered, I've documented how I optimized my Vite + React website.
3. Make the LCP Image Discoverable and Remove Render Blockers
Once fast, useful HTML is arriving, ask two questions. Does the browser know which resource matters most? And can it paint that resource without waiting on unrelated work?
Many teams focus on compressing the LCP image (the load duration) while bigger delays sit in discovery and render blocking. About 16% of pages in the 2025 Web Almanac still lazy-load their LCP image, which tells the browser to hold back the most important visual on the page.
For an image LCP, the ideal path looks like this:
- The image URL is in the initial HTML as
srcorsrcset. - It doesn't use
loading="lazy". - It has
fetchpriority="high", so the browser fetches it early. - It's preloaded only if the browser can't discover it early otherwise, as with a CSS background image.
- No render-blocking CSS or script keeps the downloaded image waiting to paint.
Here's what that looks like in HTML:
<img
  src="/hero-1280.webp"
  srcset="/hero-640.webp 640w, /hero-1280.webp 1280w"
  sizes="100vw"
  width="1280"
  height="720"
  fetchpriority="high"
  alt="Trail runner crossing a rocky ridge at sunrise"
>
The width and height attributes also reserve the image's space, which helps CLS. If you aren't sure which element is your LCP, the LCP finder identifies it and splits its time into phases.
Keep the Critical Path Short
The browser has to process render-blocking stylesheets before it can paint the content they affect. To keep that path short:
- remove unused CSS, and split a large global stylesheet by route or template;
- keep the critical CSS small, and avoid
@importchains between stylesheets; - use
deferorasyncon scripts that don't need to block parsing; - don't make visible content wait for an A/B test or a widget.
A critical CSS generator can extract a page's above-the-fold styles, so the rest of the stylesheet stops blocking the first paint.
Don't Preload Everything
fetchpriority is a hint, while preload forces a fetch. If you preload too many resources, they compete for bandwidth with the one resource you wanted to speed up.
| Resource | Preload It? |
|---|---|
| The one likely LCP image | ✅ Only if it isn't discoverable in the initial HTML |
| A critical CSS background image | ✅ Yes, since the browser finds it late |
| A critical above-the-fold font | ✅ Only when measurement shows it's discovered late |
| Hero carousel slides, many font files, every JavaScript chunk, or offscreen images | ❌ No |
If your LCP image is a CSS background or gets injected by JavaScript, preloading the LCP image walks through the markup. A resource hint validator will also catch preloads that never get used.
"LCP is 3.2 seconds" doesn't tell you what to fix. The DevTools waterfall does, because it shows how soon after TTFB the LCP request starts and whether the image waits after downloading.
4. Ship Only the JavaScript and CSS the Page Needs
A visitor reading an article shouldn't download the code for your checkout, map, slider, dashboard, chat widget, and gallery.
JavaScript costs more than its download size. The browser also has to parse, compile, and often execute it, and on slower phones that CPU cost can outweigh the transfer. Google's guidance on removing unused code notes that unused JavaScript can hurt both LCP and INP.
The 2025 Web Almanac puts the median mobile Total Blocking Time (TBT) at about 1.9 seconds. TBT adds up the time long tasks block the main thread during load, so typical pages are still doing a lot of main-thread work.
Split Code by Route and Component
Separate bundles by route or template, so a visitor doesn't pay for the whole application on every page. Then load heavy features only when they're needed, such as chart libraries on pages with a chart, or maps when the visitor scrolls near one.
Remove Dead Code and Duplicate Libraries
Audit your bundle coverage and dependency graph. The usual waste is two versions of one library, a utility library imported in full for one function, or legacy polyfills sent to modern browsers.
CSS deserves the same audit. A 300 KB design-system stylesheet loaded on every route can be almost as wasteful as an oversized script when the page uses a small part of it.
Stop Loading Plugin Assets Everywhere
On any CMS, the rule is simple: don't load a plugin's frontend assets on pages that don't use that feature. On WordPress, that means conditionally dequeuing plugin scripts and styles, and in a JavaScript app it means route and component chunks.
My order of preference for any piece of code is:
- Don't ship it.
- If it's needed later, lazy-load it.
- If it's needed now, minify and compress it.
Minification is worth doing, but deleting code beats compressing code the page never needed.
5. Optimize Images by Size, Format, and Priority
An image was the LCP element on about 76% of mobile pages and 85% of desktop pages in the 2025 Web Almanac. That makes images one of the most widely applicable fixes on the web.
But "use WebP" is too generic. A good image strategy handles two separate things: the bytes themselves, and when those bytes are requested.
Serve the Right Dimensions
Don't send a 2,400 px wide image to a 390 px wide phone screen. Use srcset, sizes, and the <picture> element, or an image CDN that generates size variants for you.
The number of wasted pixels often matters more than the choice between two modern formats. A 2,500 px AVIF squeezed into a 400 px slot can be worse than a correctly sized WebP or JPEG.
Use Efficient Formats at a Sensible Quality
In our WebP vs AVIF comparison, AVIF fared better in most tests, and I'd recommend it for photos. But a badly encoded AVIF can still be larger than a well-optimized alternative, so the format alone isn't enough.
An automated image pipeline should pick the dimensions, format, quality, device pixel ratio (DPR) variant, and crop for each slot. For one-off images, our image compressor resizes and compresses AVIF and WebP files right in your browser.
Lazy-Load Only What's Offscreen
Native loading="lazy" is useful for images and iframes below the fold, since it saves bandwidth and keeps them from competing with critical files.
However, don't lazy-load every image on the page. Google's lazy loading guide recommends loading images in the initial viewport eagerly, and the LCP image should follow every rule from step 3.
6. Remove, Delay, or Isolate Third-Party Scripts
Third-party code stacks several costs at once: extra connections, JavaScript to download and run, nested requests, long tasks, and injected content that shifts the layout. It can also regress whenever the vendor ships an update, outside your own deployment process.
I'd tackle third-party scripts in this order:
- Delete what no longer earns its cost. Audits often turn up old experiments, duplicate analytics, abandoned marketing pixels, and widgets nobody owns anymore.
- Keep the rest out of the critical rendering path. Use
deferorasync, and inject low-priority scripts after the critical content has loaded. - Load on interaction or proximity. Load a video player after a click on the poster, chat after the visitor shows intent, and maps or reviews when the visitor scrolls near them.
- Use facades for heavy embeds. A static placeholder or compressed poster image keeps the experience intact while skipping megabytes of iframe and JavaScript work during the initial load.
- Set a third-party budget. Track transfer size, main-thread time, and whether each tag loads on every page or only where it's needed.
Delaying low-priority JavaScript until the first user interaction has long been my #1 web performance hack. I've explained how to do it safely in Delay JavaScript to Boost Web Vitals, but never delay consent managers, captchas on visible forms, checkout or payment scripts, cart and variant logic, or anything needed above the fold. Verify consent and conversion tracking after the change.
Moving a script into a tag manager doesn't make its cost disappear either. A tag manager controls when tags load, but every tag still downloads and runs on the visitor's device.
7. Cache, Compress, and Use a CDN for What Remains
Caching and compression optimize resources you've already decided to ship, which is why they rank below removing code. Once the payload is intentional, make repeat delivery almost free.
Cache Fingerprinted Assets for a Year
Give versioned (hashed) CSS, JavaScript, fonts, and images a long Cache-Control lifetime. Chrome's cache lifetime insight recommends at least 30 days for cacheable subresources. For immutable fingerprinted files, a year is appropriate:
Cache-Control: public, max-age=31536000, immutable
When a file changes, publish it under a new filename or hash instead of forcing every visitor to revalidate the old URL.
Compress Text, Not Images
Brotli and gzip are still the standard choices for HTML, CSS, JavaScript, SVG, and JSON, and Brotli generally compresses better. Precompress static files at high settings, but keep dynamic responses at levels that don't add CPU time to your TTFB.
Recompressing JPEG, WebP, AVIF, or video files adds little, since they're already compressed. To see which encoding your site actually serves, run it through a Brotli test. We've also compared the algorithms in our ZSTD vs Brotli vs GZip benchmark.
Use a CDN, but Don't Expect Magic
A CDN reduces network distance and usually adds edge caching, optimized TLS, HTTP/2 and HTTP/3, compression, and image transformation. If you're choosing one, our CDN benchmark compares providers by TTFB.
But a CDN can't make up for 2 MB of unnecessary JavaScript or an origin that takes seconds to generate every document.
HTTP/2 and HTTP/3 belong in the same bucket. Enable them, but switching protocols is usually a smaller win than cutting dependencies, bytes, and execution.
8. Self-Host Your Fonts and Load Fewer of Them
Web fonts sit right in front of your text, so the way you load them shows up directly in FCP and LCP.
My team and I have tested self-hosting Google Fonts extensively over our years of speed optimization work at SpeedVitals, and it consistently makes a good difference. I'd treat it as the default for any site that uses Google Fonts.
The reason is the way the standard Google Fonts embed loads. The browser first fetches a stylesheet from fonts.googleapis.com, and only after that arrives does it discover the font files on fonts.gstatic.com. That's two extra origins, each with its own DNS lookup, TCP connection, and TLS handshake, sitting in front of your text.
The old argument that visitors already have Google Fonts cached from other sites doesn't hold anymore either. Browsers now partition their HTTP cache by site, so a font cached on another website isn't reused on yours. I've covered this in my list of web performance mistakes.
When you self-host, the font files come over the connection the browser already has open to your origin or CDN. You also control the cache headers and font-display, and you can preload the one font that matters.
We measured this on our old WordPress blog in 2021. Self-hosting Google Fonts with the OMGF plugin, which also dropped the fonts we weren't using, cut LCP from 1.8 s to 1.2 s and FCP from 1.7 s to 1.1 s in our lab test. That's roughly a third off both metrics on a page that was already fast.
The same walkthrough showed how much unused fonts can cost. A single social icons plugin injected 10 font files totaling 537 KB, nearly two-thirds of the page size, and I replaced them with a 6 KB CSS sprite.
Here are the font decisions that matter most:
- Self-host Google Fonts and other third-party font and icon libraries, and serve them from your own origin or CDN.
- Use fewer families, weights, and styles. Two families with five weights each, plus italics and an icon font, can add hundreds of kilobytes.
- Serve WOFF2, which compresses well and has broad browser support.
- Subset glyphs when licensing allows it, but be careful with multilingual and CJK sites, where naive subsetting breaks text.
- Choose
font-displaydeliberately.optionalfavors performance and avoids late swaps, whileswapshows fallback text quickly but can cause a visible change. - Preload only the critical font, and only when it's discovered late.
- Consider system fonts where your brand allows it, since they need no download at all.
If your platform truly won't let you self-host, add preconnect hints for both Google Fonts origins so the connections start earlier.
A minimal self-hosted @font-face rule that follows these points looks like this:
@font-face {
  font-family: "Brand Sans";
  src: url("/fonts/brand-sans-latin-400.woff2") format("woff2");
  font-weight: 400;
  font-style: normal;
  font-display: optional; /* use swap if the brand font must always show */
}
9. Keep the Main Thread Free for Interactions
Older performance advice usually stopped once the page looked loaded. INP changed that, because it measures how quickly the page responds to clicks, taps, and key presses across the whole visit.
A page can have a 1.5-second LCP and still feel terrible if opening a menu or adding to the cart takes 500 ms. Web.dev's INP optimization guide splits each interaction into input delay, event handler processing time, and presentation delay.
Step 4 comes before step 9 for a reason. Less JavaScript means less contention on the main thread, which usually shrinks the input delay too.
Break Up Long Tasks
A long task blocks input until it finishes. Split large synchronous work into smaller chunks and yield between them, so the browser can handle input and paint in the gaps. scheduler.postTask() helps where it's supported, and a plain setTimeout works everywhere:
async function processInChunks(items, chunkSize = 50) {
  for (let i = 0; i < items.length; i += chunkSize) {
    items.slice(i, i + chunkSize).forEach(processItem); // processItem is your own function
    // Yield so the browser can respond to input and paint
    await new Promise((resolve) => setTimeout(resolve, 0));
  }
}
Keep Event Handlers Light
When a visitor clicks a control, run the UI update they need to see first. Move unrelated analytics calls, logging, and data transforms out of the immediate interaction path.
For CPU-heavy work that doesn't need the DOM, such as large parsing jobs, data transformations, or client-side search indexing, a Web Worker can take it off the main thread entirely.
Reduce Rendering Work
Even fast JavaScript can produce a slow interaction if it triggers expensive layout or paint. Watch for very large DOM trees, thousands of rendered offscreen list items, and state updates that rerender far more of the page than needed.
On long pages, content-visibility: auto lets the browser skip layout and paint for offscreen sections. It became available in all three major browser engines in September 2025, according to web.dev. Test it for accessibility and layout side effects before you ship it.
Find the Slow Interaction in the Field
CrUX can tell you that INP is poor, but not which interaction is responsible. RUM with attribution can tie a slow interaction to a specific element, route, and device class.
To reproduce it in the lab, our INP debugger simulates clicks and breaks down the delay with Long Animation Frames data.
10. Keep the Layout Stable
A page that loads fast but jumps around while someone tries to tap a button still feels broken. Good CLS is 0.1 or less at p75.
Web.dev's CLS guide names four common causes: images without dimensions, ads and embeds without reserved space, injected content, and web fonts. The fixes map directly to them:
- Reserve geometry for every image, video, and iframe with
widthandheightattributes or a knownaspect-ratio. - Reserve ad and widget slots. If a 300 px block may arrive later, hold its space instead of pushing the content down.
- Don't insert banners above existing content without reserved space. Cookie notices, app banners, and sale bars are frequent culprits.
- Match fallback font metrics so the swap to the web font doesn't reflow your text. Descriptors such as
size-adjusthelp here. - Animate
transformandopacityinstead of properties that affect layout.
Measure CLS in the field as well, since shifts that happen after an interaction rarely show up in a Lighthouse cold load. In the lab, the CLS finder replays shifts frame by frame so you can see which element moved. The code for each fix is in How to Reserve Space to Prevent Layout Shift.
Advanced Optimizations for Already Fast Sites
These features can make a fast site feel almost instant, but none of them fixes a slow origin or a heavy bundle.
Back/Forward Cache (bfcache)
All major browsers support bfcache, which restores a page from memory when the visitor presses back or forward. Web.dev's bfcache article (updated July 2026) says Chrome data shows about 1 in 10 desktop navigations and 1 in 5 mobile navigations are back/forward navigations.
Avoid unload event listeners and other patterns that make pages ineligible. I've covered eligibility and debugging in Back Forward Cache Explained. It sits outside the top ten only because it speeds up return navigations, not the first visit.
Speculation Rules
Speculation Rules let the browser prefetch or prerender the pages a visitor is likely to open next, and a completed prerender makes the navigation almost instant. They work best on predictable paths: the next article, paginated content, or product to cart.
<script type="speculationrules">
{
  "prerender": [{
    "where": { "href_matches": "/blog/*" },
    "eagerness": "moderate"
  }]
}
</script>
Wrong predictions waste bandwidth and CPU, and prerendered pages can trigger analytics side effects. Chrome is still expanding the model (including a prerender_until_script origin trial in 2026), and support differs across browsers, so treat it as progressive enhancement.
103 Early Hints
Early Hints let your server or CDN tell the browser about critical resources before the final HTML is ready. The 2025 Web Almanac found usage still low, generally under about 5 to 6% of sites.
If your backend is simply slow, fix or cache it first, because Early Hints only hide part of the server time. I've covered the WordPress and Cloudflare setup for Early Hints separately, and the Early Hints checker confirms whether your site sends them.
What Not to Prioritize First
These optimizations are real, but they get far more attention than their impact deserves:
| Common Focus | Why It's Overrated | Do This Instead |
|---|---|---|
| HTTP/3 as the headline fix | It won't fix a slow origin, a 2 MB bundle, or late LCP discovery | Enable it, then work through steps 1 to 6 |
| Minification as the JavaScript strategy | Removing and splitting code usually saves far more | Stop shipping code the page doesn't use |
| Cutting the request count at all costs | HTTP/2 and HTTP/3 changed the old "every request is expensive" model | Target critical-path dependencies, bytes, and execution |
| Lazy-loading or preloading everything | Both delay or crowd out the resources that matter | Lazy-load offscreen content, and preload only what's discovered late |
| Chasing a 100 Lighthouse score | A lab score isn't the business goal | Improve p75 LCP, INP, and CLS by template, device, and region |
A Performance Audit Order That Works on Any Platform
The ten steps above are a default. On a real site, I'd let the data choose the starting point:
- Start with real-user data. Check p75 LCP, INP, and CLS, the TTFB distribution, mobile versus desktop, and your top templates.
- Find the layer that owns the delay.
- High TTFB: check redirects, the cache hit ratio, origin and database time, and whether the CDN caches the HTML.
- Good TTFB but high LCP: split LCP into its parts, then check discovery, lazy loading, render blockers, and file size.
- High INP: find the slow interaction and split it into input delay, handler time, and presentation delay.
- High CLS: capture the element that actually shifts, then fix the cause behind it.
- Test under realistic conditions: a slower mobile CPU and network, cold and warm cache, the consent banner present, and your usual third-party stack enabled. Our batch test runs several locations or devices in one go.
- Verify with field data after you deploy. One improved Lighthouse run isn't a win until the p75 real-user numbers move.
- Prevent regressions with budgets or CI checks on JavaScript bytes per route, third-party main-thread time, LCP and TTFB lab thresholds, and cache headers.
Summing Up
Website performance optimization comes down to removing waiting before removing work.
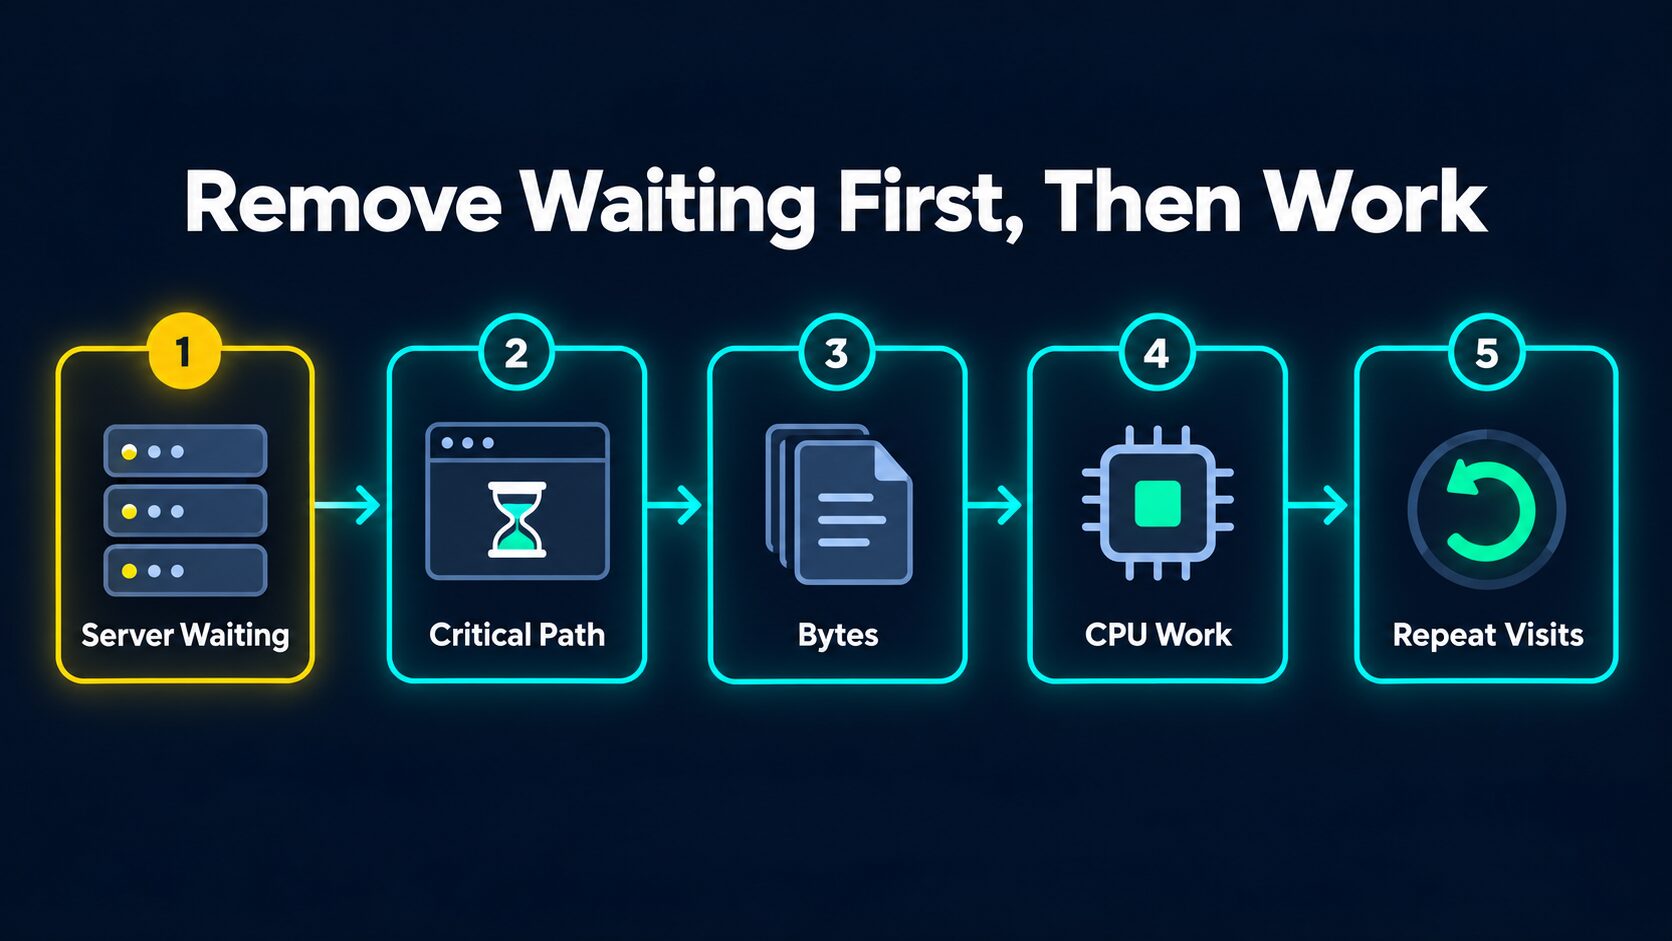
Server waiting comes first, then the waiting on the critical path. After that, cut the bytes, then the CPU work on the main thread. Repeat-visit features such as bfcache and Speculation Rules come last, once the first visit is already fast.
But don't apply all ten steps blindly. A site with a 2-second TTFB shouldn't spend its first week tuning font preloads. And a site with a 150 ms TTFB and a 500 ms INP shouldn't spend it migrating CDNs.
I recommend starting with your real-user data, finding the largest sequential bottleneck, and fixing that first. If the field data doesn't point anywhere obvious, check your TTFB from the regions your visitors come from, because every other step on this list waits for it.