Best Website Speed Testing Tools in 2026

Looking for a website speed testing tool that tells you why a page is slow? Then you've come to the right place!
I've ranked the 10 best website speed testing tools, from free one-off checks like PageSpeed Insights to monitoring platforms that measure your real visitors. Each tool gets a score out of 10, along with the reason it landed where it did.
SpeedVitals (9.5/10) is the best website speed testing tool for most site owners, developers, and agencies. Even its Free plan includes lab tests with a waterfall from 10 locations, TTFB tests from 30 locations, real-user monitoring (RUM), and one monitored page. The $49/month Growth plan tests from 35 locations. PageSpeed Insights (9.1) is the best free one-off check, and DebugBear (9.0) is the best paid pick if you need white-label reports.
SpeedVitals is our own product, so I've listed its cons just as plainly as everyone else's. Here's how the 10 tools compare at a glance (prices from each vendor's pricing page at the time of writing, monthly billing unless noted):
| Rank | Tool | Score | Best For | Free Plan or Test | Paid Plans From |
|---|---|---|---|---|---|
| 1 | SpeedVitals | 9.5/10 | Lab tests, TTFB tests, RUM, and monitoring in one tool | ✅ Free plan | $19/month |
| 2 | PageSpeed Insights | 9.1/10 | A quick check with Google's field data | ✅ Completely free | N/A |
| 3 | DebugBear | 9.0/10 | Agencies and pages behind a login | ✅ Single-location test | $125/month |
| 4 | GTmetrix | 8.6/10 | Simple lab tests and cheap monitoring | ❌ Trial only | $5.99/month |
| 5 | WebPageTest | 8.4/10 | Deep, scriptable lab tests | ✅ 150 runs/month | $180/year |
| 6 | SpeedCurve | 8.2/10 | Large teams with performance budgets | ❌ | $90/month |
| 7 | Lighthouse | 8.0/10 | Local builds and CI checks | ✅ Open source | N/A |
| 8 | Uptrends | 7.7/10 | Uptime plus browser monitoring | ✅ 10-location test | $42/month (yearly, uptime only) |
| 9 | RUMvision | 7.4/10 | RUM for high-traffic sites | ❌ | €150/month |
| 10 | Calibre | 7.2/10 | Many low-traffic sites on a small team | ✅ 3-location test | $75/month |
How I Ranked and Scored These Tools
I scored every tool on the same six things:
- Diagnostics: what the report shows beyond a score, such as a request waterfall, a filmstrip, the LCP element, layout shift details, and Lighthouse audits.
- Field data: whether you get CrUX data, real-user monitoring of your own visitors, or neither.
- Test control: how many locations, devices, and connection settings you can test with.
- Monitoring: scheduled tests, history, and alerts when a page gets slower.
- Ease of use: how quickly someone new to web performance gets a useful answer.
- Price: the free tier first, then what a paid plan costs.
Diagnostics and field data carry the most weight. A lab test tells you why a page is slow, while field data tells you whether real visitors actually get a slow page. Google's Core Web Vitals assessment uses field data from CrUX (the Chrome User Experience Report), measured at the 75th percentile over 28 days. Our guide on field data vs origin summary explains how to read it.
Our team has used SpeedVitals, PageSpeed Insights, Lighthouse, GTmetrix, WebPageTest, and DebugBear extensively over the years. For SpeedCurve, Uptrends, RUMvision, and Calibre, this is an assessment based on their websites and documentation. I didn't run any new speed tests for this article, and every price comes from the vendor's own pricing page.
Why Speed Testing Tools Give Different Scores
The same page can get a great score in one tool and a mediocre one in another, and both results can be correct. Every tool tests under its own default setup (device, network throttling, and location), so their scores don't share a scale.
One Redditor said GTmetrix gave their site a perfect 100% with no warnings, while PageSpeed Insights gave it 80% and a long list of warnings. They didn't say why, but the default settings explain a lot of that gap.
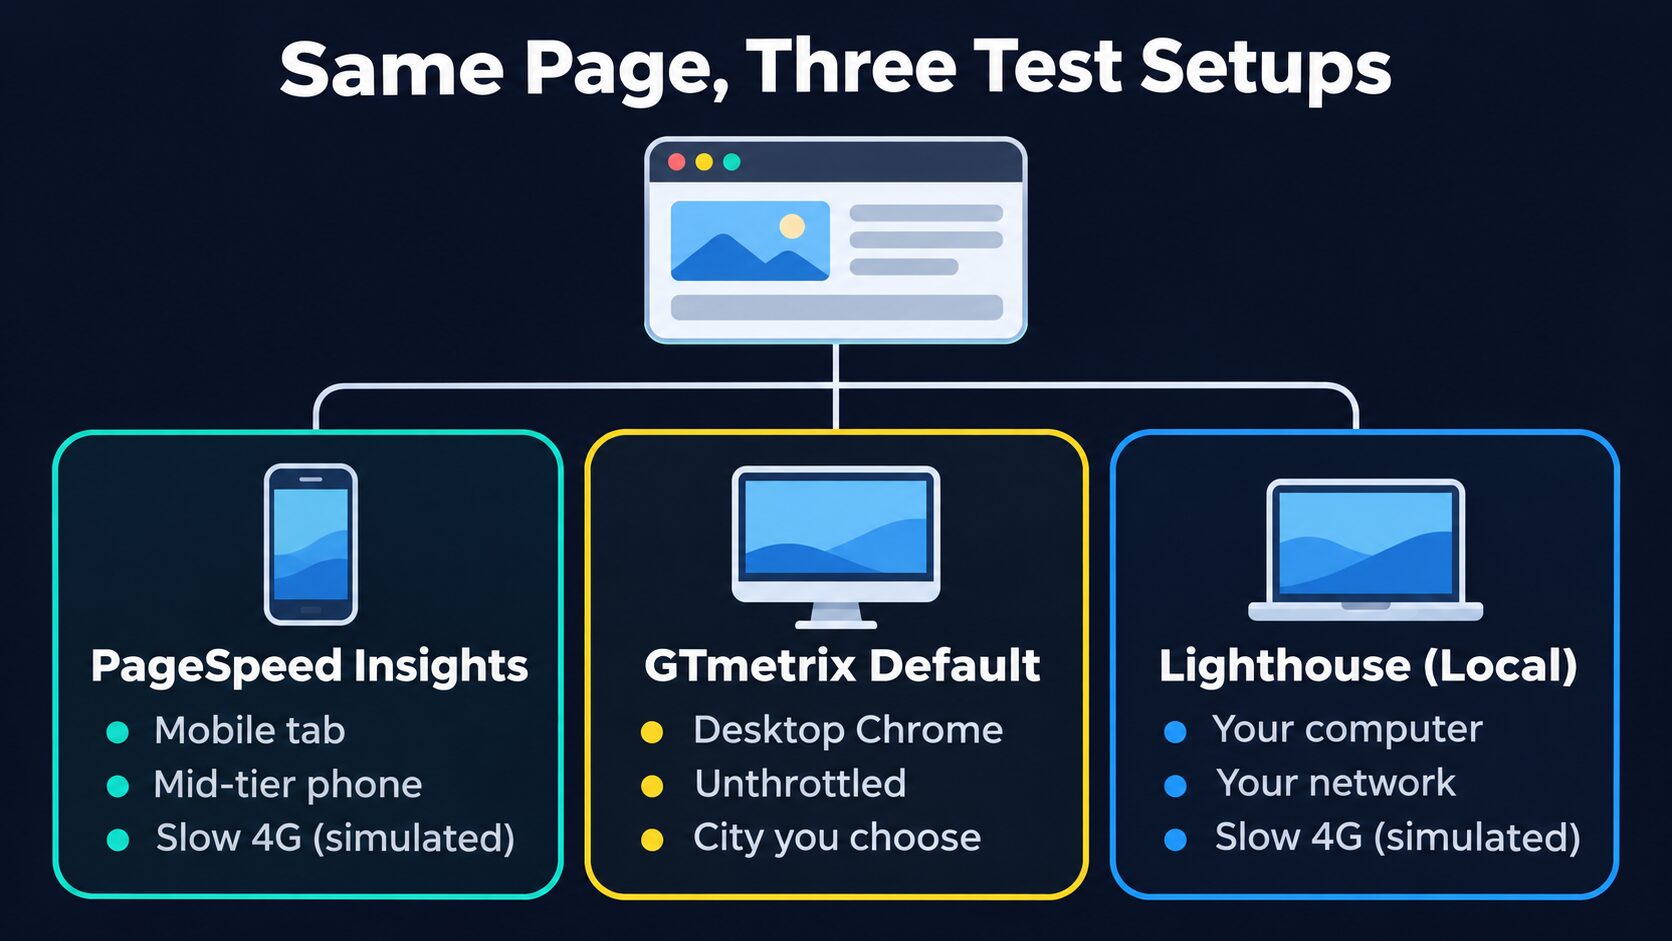
Unless you change its analysis options, GTmetrix tests in desktop Chrome on an unthrottled connection. PageSpeed Insights opens on a mobile test instead, which simulates a mid-tier phone on a slow network. Lighthouse in Chrome DevTools uses the same mobile profile, but it runs on your computer, so a fast laptop and a busy one will score the same page differently.
Hence, compare scores only within one tool and with the same settings, and let field data have the final word.
1. SpeedVitals
Score: 9.5/10
Why it ranks #1: It's the only tool here with lab tests, a multi-location TTFB test, real-user monitoring, and scheduled monitoring on a free plan. It loses half a point for the gaps below: no white-label reports and API access only from the $99/month Pro plan.
SpeedVitals runs Lighthouse-based lab tests from the device and location you pick. Its reports add the diagnostics you need to find the cause: a request waterfall, a resource summary, unused CSS and JavaScript, a third-party domain map, the LCP element, and a layout shift visualizer. Every report also shows CrUX field data for the page and the origin, with up to 12 months of history.
On top of the speed test, you get:
- TTFB test: the TTFB test measures response times from 30 locations on the Free plan and 40+ on paid plans, with cache status and CDN detection. You can see right away whether your HTML is a cache hit in every region. When it isn't, our guide on reducing server response time covers the fixes.
- Batch test: the batch test runs one URL across many locations and devices in one go (10 concurrent tests on Free, up to 50 on Ultimate).
- Real-user monitoring: RUM shows the LCP, INP, and CLS of your actual visitors, along with the elements and interactions behind poor scores. It also flags slow third-party scripts, records a waterfall for real page views, and sends alerts on your RUM data. RUM comes with every plan, and the Free plan covers 5,000 page views a month on one website.
- Monitoring: scheduled speed and TTFB tests, with email, Slack, or webhook alerts and a weekly digest.
- No-code experiments: try an optimization on a page without touching your code.
These are the SpeedVitals plans:
| SpeedVitals Plan | Monthly Price | Speed + TTFB Tests per Week | Speed Test Locations | RUM Page Views per Month | Monitoring Slots |
|---|---|---|---|---|---|
| Free | $0 | 15 + 15 | 10 | 5,000 | 1 |
| Starter | $19 | 300 + 300 | 10 | 5,000 | 3 |
| Growth | $49 | 750 + 750 | 35 | 20,000 | 5 |
| Pro | $99 | 1,500 + 1,500 | 35 | 200,000 | 10 |
| Ultimate | $399 | 3,500 + 3,500 | 35 | 1,000,000 | 30 |
Yearly billing gives you two months free. Speed monitoring runs every 24 hours on Free and Starter, down to every 3 hours on Ultimate, and TTFB monitoring (from Starter) goes down to hourly. Email alerts start on Starter, Slack and team members on Growth, and webhooks and API access on Pro.
Now the cons. SpeedVitals has no white-label reports, and API access starts on the $99/month Pro plan. The Free and Starter plans also test from 10 locations instead of 35.
| Pros | Cons |
|---|---|
| ✅ Free plan with lab tests, TTFB tests, and RUM | ❌ No white-label reports |
| ✅ 35 test locations and 30 devices (Growth and above) | ❌ API access only on Pro and above |
| ✅ TTFB test from 40+ locations with cache status | ❌ 10 test locations on Free and Starter |
| ✅ Batch tests across locations and devices | |
| ✅ Waterfall, LCP element, and layout shift visualizer | |
| ✅ 12 months of CrUX history | |
| ✅ RUM with LCP, INP, and CLS attribution | |
| ✅ RUM alerts | |
| ✅ Email, Slack, and webhook alerts | |
| ✅ No-code experiments |
If you want one tool to test, debug, and monitor your site, SpeedVitals is the one I'll highly recommend. Start on the Free plan, test your most important page from the regions your visitors come from, and add the RUM script to check whether real users get the same result.
2. Google PageSpeed Insights
Score: 9.1/10
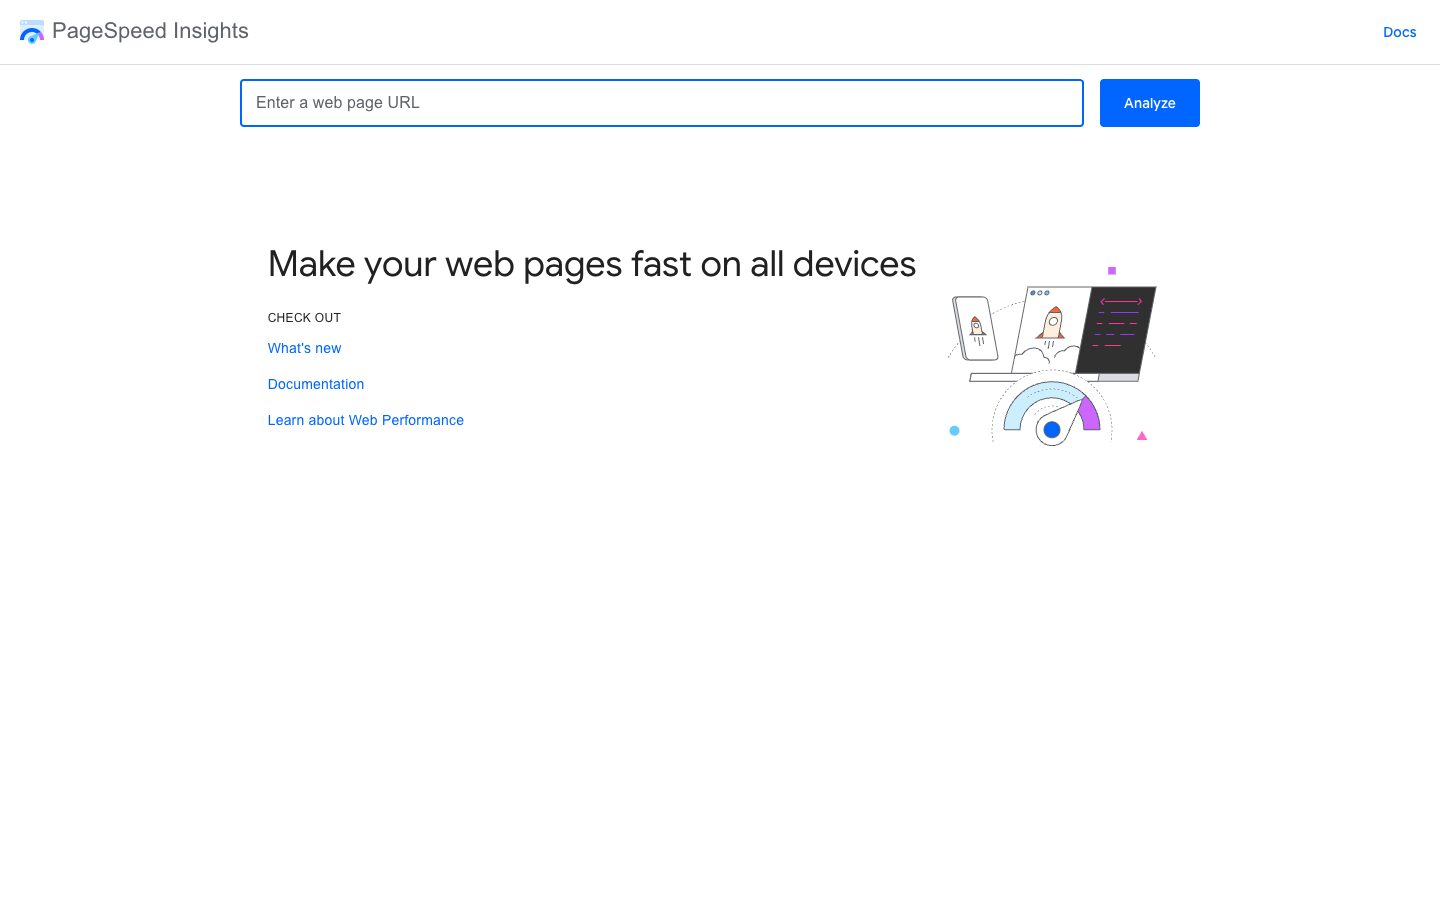
Why it ranks #2: It's free, it needs no sign-up, and it shows Google's own field data for your page next to a full Lighthouse report. It ranks below SpeedVitals because you can't choose the test location, device, or connection, there's no waterfall chart, and it has no monitoring.
PageSpeed Insights (PSI) is the first speed test most people run. The top of the report shows CrUX data for the URL and the whole origin, with a pass or fail Core Web Vitals assessment. Those numbers are the 75th percentile of real Chrome users over the previous 28 days. Below them sits a Lighthouse lab test for mobile and desktop, with the performance score, metrics, and audits, and a free API lets you run the same checks from your own scripts.
That field data is why PSI ranks this high. It comes from the same CrUX dataset as the Core Web Vitals report in Search Console, and no lab score can replace it.
Another site owner on Reddit said Google's speed test gave their site close to 100% for performance. At the same time, Search Console was showing them critical Core Web Vitals warnings. A lab score comes from one simulated visit, so it can't show you slow phones or visitors on the other side of the world. If your lab score and field data disagree, trust the field data and use a lab test to find the cause.
The limits are all on the lab side. PSI runs its test from a Google data center in North America, Europe, or Asia, and you can't pick which one or change the device and connection. There's no waterfall chart, no history, and no alerts. A page without enough Chrome traffic also gets no field data of its own, so PSI falls back to the origin's data or shows none. Our list of PageSpeed Insights alternatives goes deeper into these gaps.
| Pros | Cons |
|---|---|
| ✅ Free, with no sign-up | ❌ No test location choice |
| ✅ CrUX field data for the URL and origin | ❌ No device or connection settings |
| ✅ Lighthouse audits for mobile and desktop | ❌ No waterfall chart |
| ✅ Free API | ❌ No monitoring, history, or alerts |
| ❌ No field data for low-traffic pages |
For a quick check, and for the field data alone, PSI belongs in everyone's toolkit. For debugging a slow page, though, I wouldn't use it as my only tool.
3. DebugBear
Score: 9.0/10
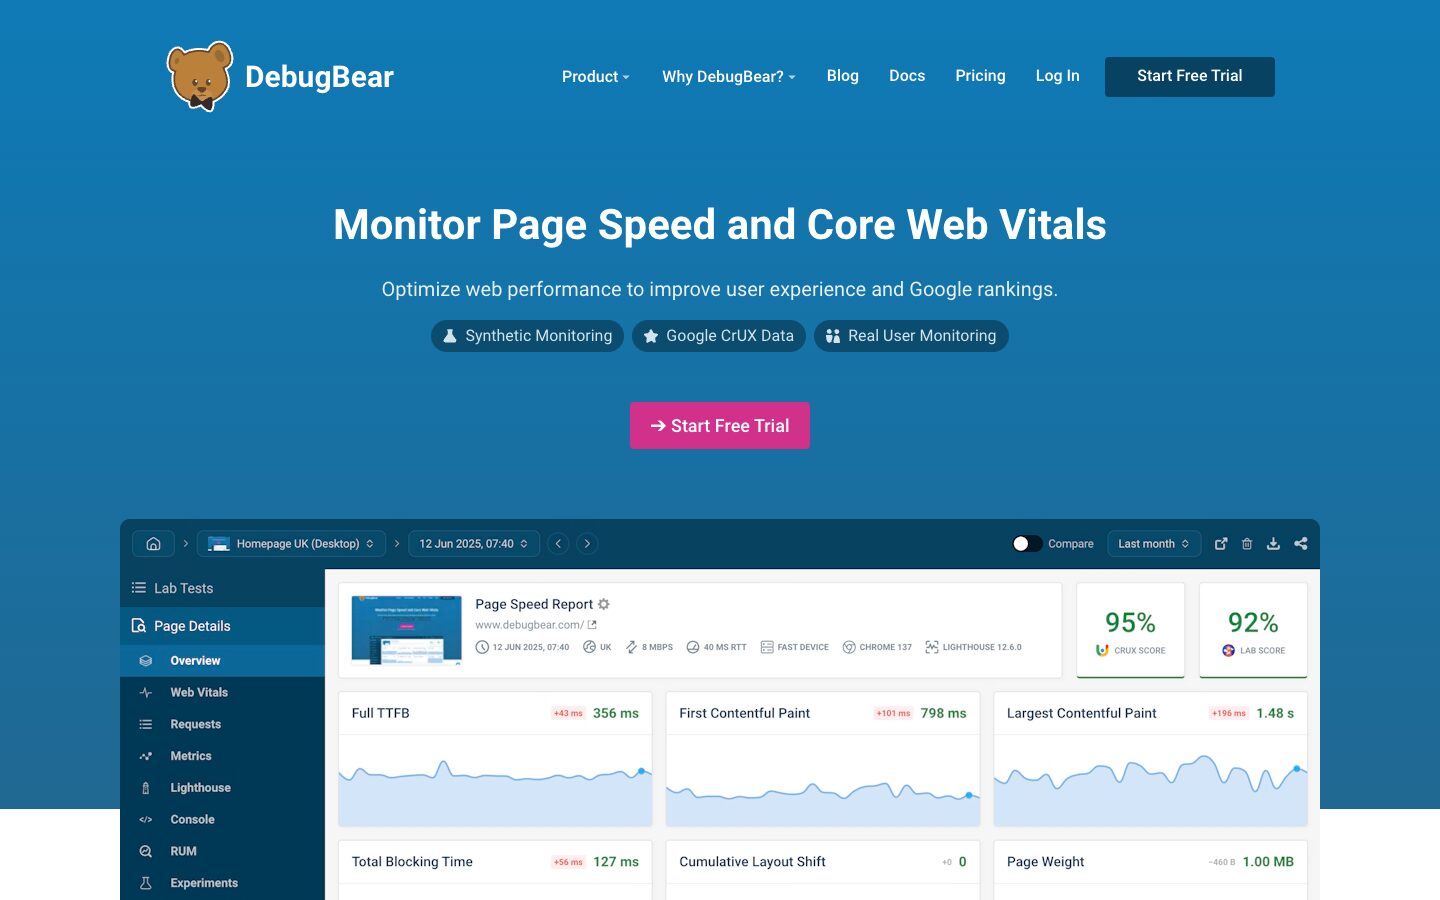
Why it ranks #3: DebugBear is still my second favorite performance tool after SpeedVitals, and if this list only covered paid monitoring tools, it would rank second. It sits below PageSpeed Insights because the full product has no free plan, and its free speed test only runs from one location (US East).
DebugBear combines lab tests, CrUX data, and RUM. Its lab tests run Lighthouse from 30+ locations on a real throttled connection instead of simulated throttling, which DebugBear says brings the metrics closer to what visitors get. I've always liked its waterfall, which marks requests that are render-blocking, preloaded, lazy-loaded, or deferred. Its reports also break LCP into subparts, so you can see where the time goes.
Its RUM ties slow INP interactions to page elements and uses Long Animation Frames to point at the scripts behind them. You also get login and user flow tests, uptime monitors, page speed experiments, a Looker Studio integration, white-label exports, and 24 months of data on every plan.
Startup costs $125/month ($99/month billed yearly) for 4,000 synthetic tests, 100,000 RUM page views, 10 uptime monitors, and 10 users. Team costs $325/month and Corporate / Agency $899/month. There's a 14-day free trial with no credit card. The free tools include the single-location speed test, a TTFB test from 10 locations, and an INP debugger. Our list of DebugBear alternatives compares its plans in more detail.
| Pros | Cons |
|---|---|
| ✅ Lab tests on a real throttled connection | ❌ No free plan (14-day trial) |
| ✅ Waterfall badges and LCP subparts | ❌ Paid plans start at $125/month |
| ✅ RUM with INP and Long Animation Frames attribution | ❌ Free speed test only runs from US East |
| ✅ Login and user flow testing | |
| ✅ White-label exports and Looker Studio | |
| ✅ 24 months of data on every plan |
Pick DebugBear if you manage client sites that need white-label reports, or if your important pages sit behind a login.
4. GTmetrix
Score: 8.6/10
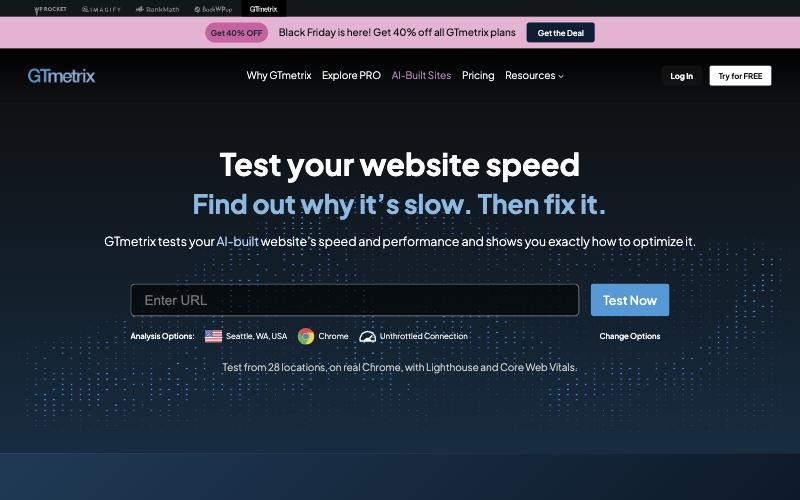
Why it ranks #4: GTmetrix puts a waterfall, filmstrip, video, and CrUX data in a report that's easy to follow, and its Advanced plan tests from 28 locations for $29.99/month. It trails DebugBear because it has no RUM, the cheaper plans test from only 5 or 10 locations, and there's no permanent free plan anymore.
GTmetrix has been around since 2010, and it's still one of the simplest lab tools for people new to web performance. It loads your page in real Chrome, runs Lighthouse, and combines the Performance score with a Structure score into a GTmetrix Grade. The report includes a waterfall with full request and response headers, a filmstrip, video playback, and CrUX field data with trends going back up to 6 months.
Paid plans add mobile testing on 55+ simulated phones and tablets, scheduled monitoring, a REST API, and an MCP server for AI tools. Here's what the plans look like:
| GTmetrix Plan | Monthly Price | On-Demand Tests | Monitored Slots | Test Locations | Hourly Monitoring |
|---|---|---|---|---|---|
| Lite | $5.99 | 50/month | 1 | 5 | ❌ |
| Core | $11.99 | 150/month | 3 | 10 | ❌ |
| Advanced | $29.99 | Unlimited (fair use) | 10 | 28 | ✅ |
| Expert | $59.99 | Unlimited (fair use) | 50 | 28 | ✅ |
Yearly billing gives you two months free. Team seats come only with Expert, white-label PDF reports only with Enterprise plans, and the free account is a trial. If you're moving away from GTmetrix, our list of GTmetrix alternatives covers the options.
| Pros | Cons |
|---|---|
| ✅ Easy to use | ❌ No RUM |
| ✅ Waterfall, filmstrip, and video | ❌ No permanent free plan |
| ✅ CrUX trends up to 6 months | ❌ 5 test locations on Lite, 10 on Core |
| ✅ 28 test locations (Advanced and Expert) | ❌ Team seats only on Expert |
| ✅ Cheap entry plan | ❌ White-label reports only on Enterprise |
| ✅ REST API and MCP server |
GTmetrix is the better choice if you want a simple lab tool with cheap monitoring and your site gets enough Chrome traffic to show up in CrUX. Just switch to a mobile device and a throttled connection when most of your visitors use phones.
5. WebPageTest
Score: 8.4/10
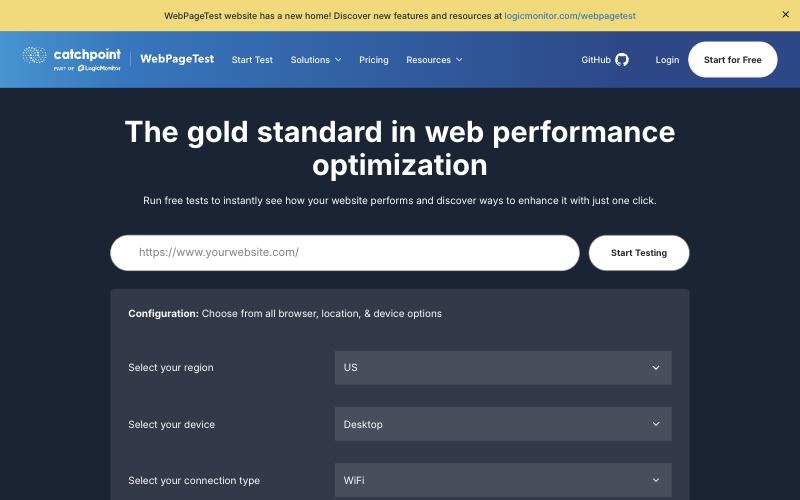
Why it ranks #5: WebPageTest is the most configurable lab testing tool on this list, and it has a free plan. It ranks below GTmetrix for the reason I've given for years: its interface has a steep learning curve that can scare away anyone new to web performance. It also has no RUM of its own.
WebPageTest is the tool many performance engineers open when they need full control of a test, from the region and device to the connection type. The free Starter plan includes 150 test runs a month from 30 locations, with 3 runs per test. It also comes with filmstrips and video, Lighthouse, an Opportunities report, and custom scripts of up to 3 steps.
Pro starts at $180/year for 1,000 runs a month. It adds scheduled tests, customizable alerts, an API, experiments, private and bulk tests, 40 locations, and 13 months of test retention (the free plan keeps tests for 60 days). Catchpoint acquired WebPageTest in 2020, and Catchpoint is now part of LogicMonitor, which hosts its pricing.
| Pros | Cons |
|---|---|
| ✅ Deepest test configuration | ❌ Steep learning curve |
| ✅ Free plan with 150 runs/month | ❌ No RUM of its own |
| ✅ Filmstrip and video capture | ❌ 60-day test retention on the free plan |
| ✅ Custom scripts and experiments | |
| ✅ Pro from $180/year |
If you're comfortable reading waterfalls and connection settings, WebPageTest gives you more control than any other free tool here. If you're not, start with something simpler.
6. SpeedCurve
Score: 8.2/10
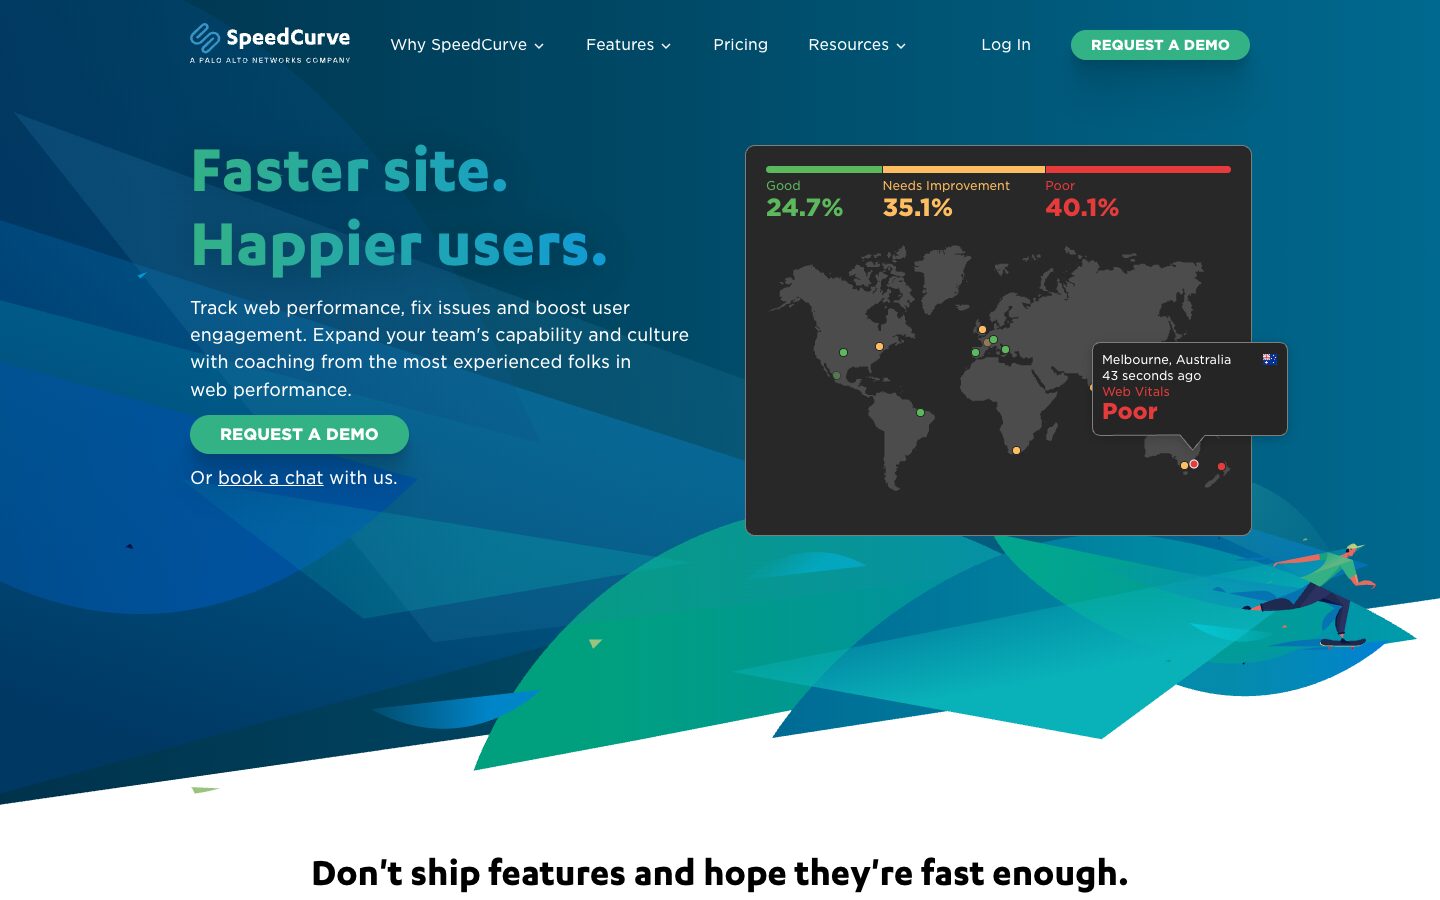
Why it ranks #6: SpeedCurve gives large teams RUM, synthetic tests, performance budgets, and CI/CD integration in one platform. It lands below WebPageTest because it has no free plan or listed trial, the minimum is $90/month, and smaller plans show only 3 months of RUM history.
SpeedCurve's strength is everything around the data: performance budgets with alerts, CI/CD integration through its API, competitor benchmarking, and unlimited users and teams on every plan. Its RUM includes INP attribution and Long Animation Frames data.
You build a plan from RUM page views and synthetic checks. Starter begins at $90/month, and Growth, from $576/month, adds 13 months of data retention, high-priority support, and priority synthetic testing. On its calculator, 2 million RUM page views cost $270/month and 30,000 synthetic checks $450/month, with 20% off for annual billing. On smaller plans, SpeedCurve's support docs say you can see only the last 3 months of RUM data.
SpeedCurve has also changed owners twice in under a year. Embrace acquired it in November 2025, and Palo Alto Networks completed its acquisition of Embrace in August 2026. Our list of SpeedCurve alternatives covers both points in more detail.
| Pros | Cons |
|---|---|
| ✅ RUM and synthetic monitoring in one tool | ❌ No free plan or listed trial |
| ✅ Performance budgets and CI/CD integration | ❌ $90/month minimum |
| ✅ Unlimited users and teams | ❌ 3 months of RUM history on smaller plans |
| ✅ $135 per million RUM page views | ❌ Two ownership changes in under a year |
| ✅ Competitor benchmarking |
SpeedCurve fits a large team with high traffic and a performance budget process wired into its deploys.
7. Lighthouse
Score: 8.0/10
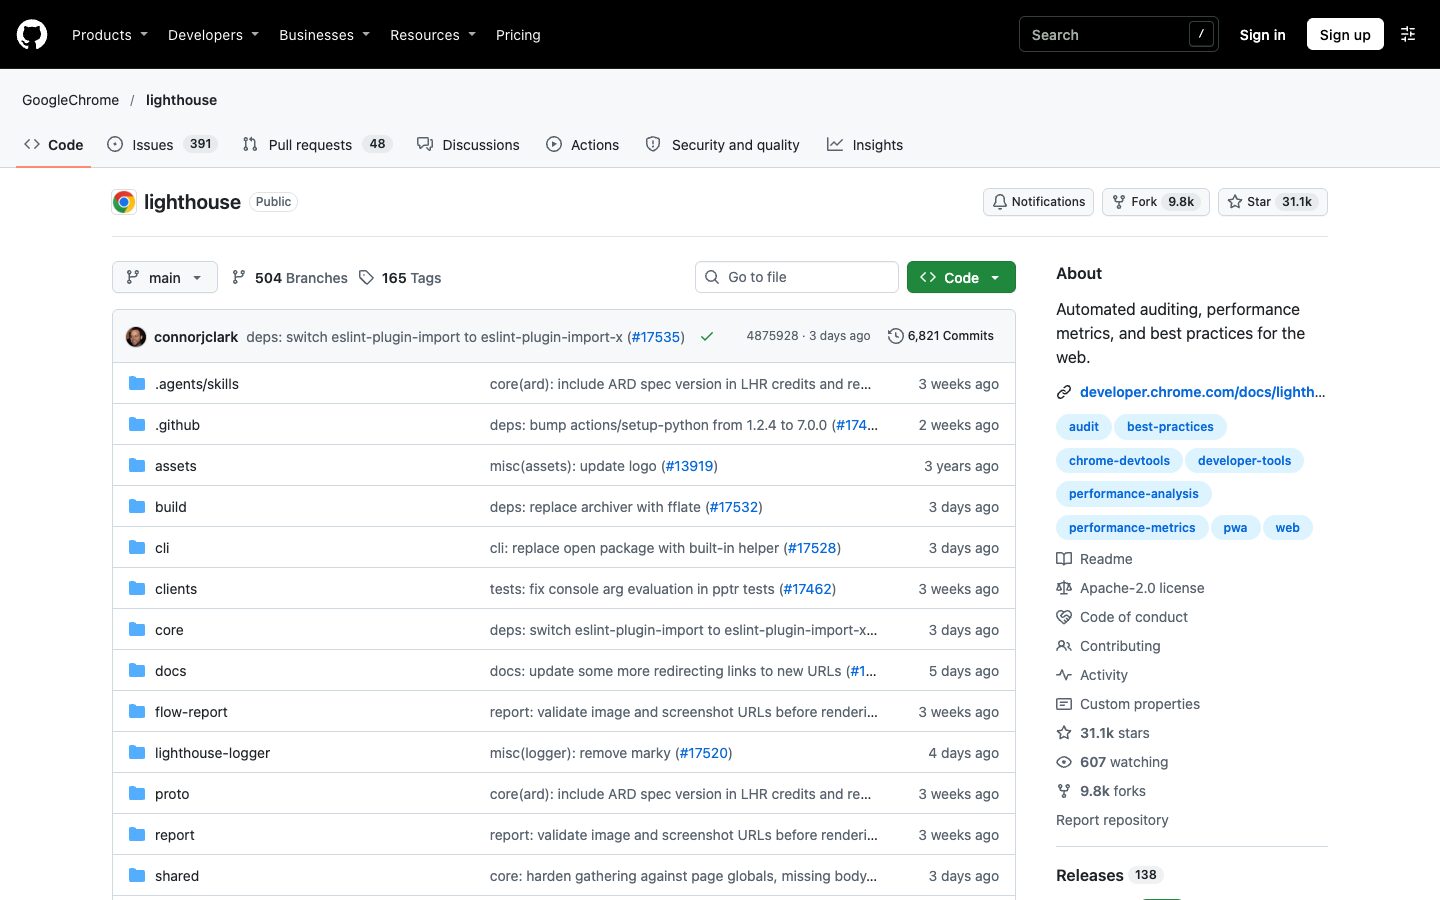
Why it ranks #7: Lighthouse is free, open source, and the engine behind PageSpeed Insights and most lab tools on this list. It's also the easiest way to test a local or staging build. It ranks below SpeedCurve because it has no field data and no monitoring, and its results depend on the computer you run it on.
Lighthouse is Google's open-source auditing tool, released under the Apache-2.0 license and still actively maintained. You can run it from the Lighthouse panel in Chrome DevTools, as a Chrome extension, from the command line, or as a Node module. Besides performance, it audits accessibility, best practices, and SEO.
The command-line version needs Node 22 or later:
npm install -g lighthouse
lighthouse https://example.com --preset=desktop --output=html --output-path=./report.html
Leave out --preset=desktop to run the default mobile test, and add --only-categories=performance when you only care about speed. Lighthouse also supports user flows (navigation, timespan, and snapshot modes) for interactions and multi-step processes such as a checkout, and Lighthouse CI, a separate official project, runs it on every commit.
The catch is the environment. A local run uses your CPU, your network, and whatever else your computer is doing at that moment. So the same page can score differently on two machines, or even on one machine with a few browser extensions running. That's why I recommend Lighthouse for development and staging builds, and PageSpeed Insights, SpeedVitals, or DebugBear for live sites.
| Pros | Cons |
|---|---|
| ✅ Free and open source | ❌ Results depend on your computer |
| ✅ Tests local and staging builds | ❌ No field data |
| ✅ DevTools panel, CLI, and Node module | ❌ No waterfall chart |
| ✅ User flows and Lighthouse CI | ❌ No test locations or monitoring |
| ✅ Accessibility, best practices, and SEO audits |
8. Uptrends
Score: 7.7/10
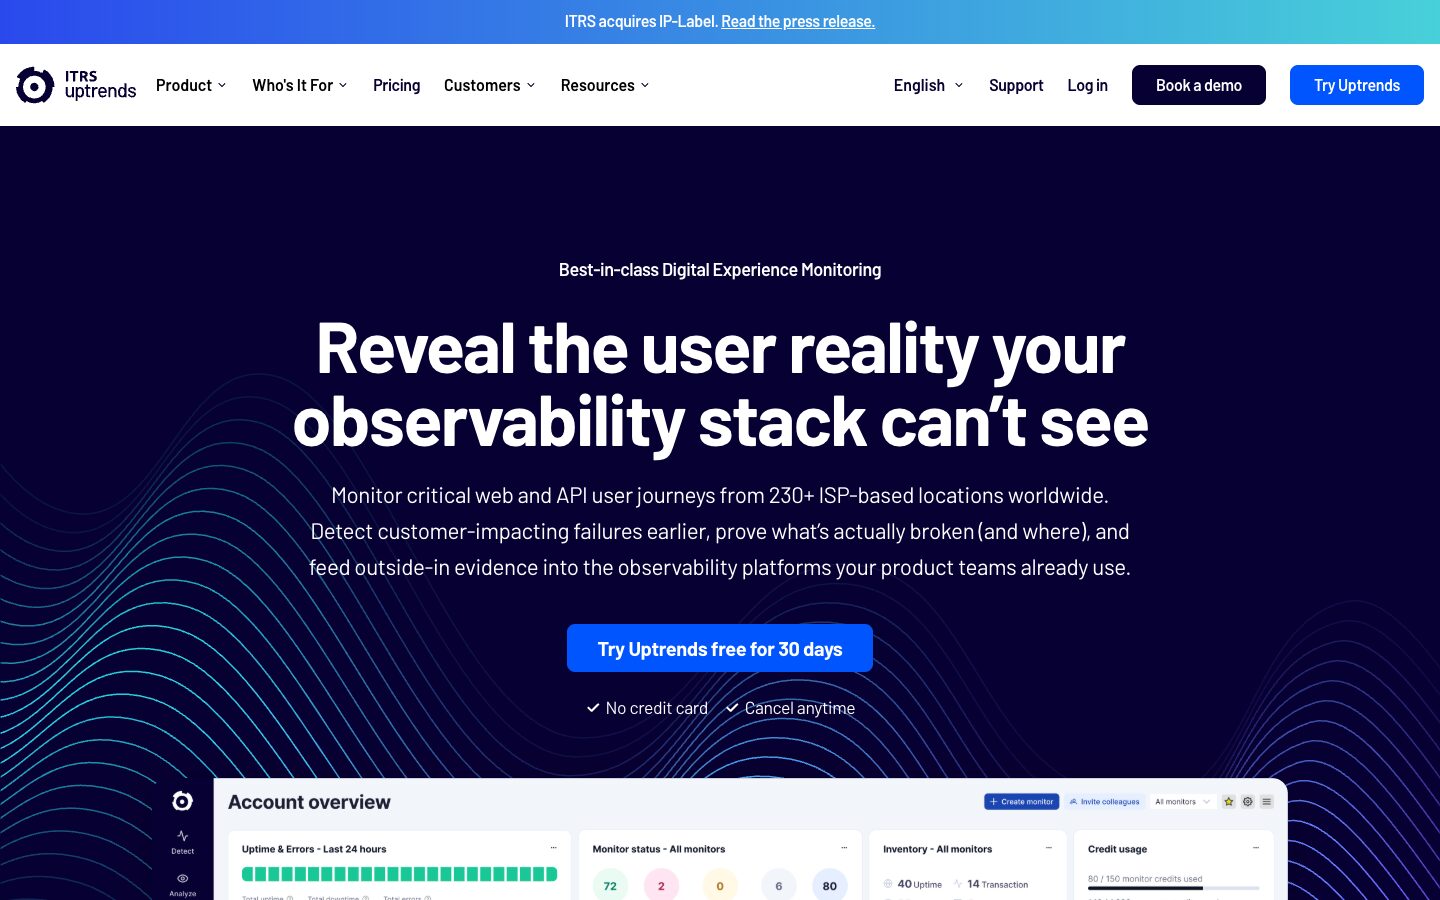
Why it ranks #8: Uptrends has a free speed test that runs Chrome or Edge from 10 locations, with a waterfall and filmstrip, and its paid plans monitor from 230+ checkpoints. What keeps it below Lighthouse is its focus on uptime and digital experience monitoring over performance debugging, and the price: one browser monitor costs $350/month on its Core plan.
Uptrends, part of ITRS, is mainly an uptime and synthetic monitoring platform. Its free website speed test loads your page in Chrome or Edge from one of 10 locations, with a choice of screen sizes and connection throttling. The report shows Core Web Vitals and W3C navigation timings, a filmstrip, a waterfall with request and response headers, and the PageSpeed Insights score with its recommendations.
Paid accounts test from 230+ checkpoints around the world. The Pro plan runs browser checks in the latest Chrome and Edge as often as every 5 minutes and simulates multi-step transactions such as logins and checkouts. Alerts go out by email, SMS, voice, webhooks, Slack, or PagerDuty. RUM is a paid add-on.
Pricing uses monitoring credits, with prices shown for annual billing. Core starts at $42/month and Pro at $60/month, which is the price of one uptime monitor. A browser monitor, the type that actually loads your page, takes 50 credits, which the pricing table lists at $350/month on Core and $500/month on Pro. There's a 30-day free trial with no credit card.
| Pros | Cons |
|---|---|
| ✅ Free speed test from 10 locations | ❌ Browser monitoring from $350/month |
| ✅ Chrome and Edge testing | ❌ Built for uptime more than debugging |
| ✅ Waterfall, filmstrip, and Core Web Vitals | ❌ RUM is a paid add-on |
| ✅ 230+ checkpoints on paid plans | ❌ Annual commitment |
| ✅ Transaction and API monitoring |
If you already need uptime, API, and transaction monitoring, Uptrends covers page speed as one part of that job.
9. RUMvision

Score: 7.4/10
Why it ranks #9: RUMvision shows how fast your site is for real visitors, with daily regression alerts and script attribution, and its entry plan covers 1.5 million page views. But it has no lab tests, so you can't run a speed test with it on demand. That's why it sits this low on a list of testing tools.
RUMvision is a RUM-only tool based in the Netherlands. You add its script to your site, and it reports your visitors' Core Web Vitals in real time, without the 28-day delay of CrUX and Search Console.
The Growth plan costs €150/month for 1.5 million page views on 2 domains. It includes weekly reports, daily regression alerts, and a CrUX comparison with up to 10 competitors. It also breaks down the first-party and third-party scripts slowing you down, and comes with a free 1-hour setup call.
Scale costs €700/month. Extra domains cost €20/month each (every subdomain counts as a separate domain), extra page views cost €75/month per million, and annual billing saves 10%. RUMvision also has an MCP server and an API, and its free tools pull CrUX data for any domain, including 6 months of Core Web Vitals history.
When RUMvision tells you a page is slow, though, you'll need a separate lab tool to reproduce the problem and check your fix. Our list of RUMvision alternatives covers which tools add lab tests.
| Pros | Cons |
|---|---|
| ✅ 1.5 million page views on the entry plan | ❌ No lab or synthetic tests |
| ✅ Daily regression alerts and weekly reports | ❌ No free plan |
| ✅ First-party and third-party script breakdown | ❌ €150/month is steep for small sites |
| ✅ Competitor CrUX comparison | ❌ Every subdomain counts as a separate domain |
| ✅ MCP server and API |
RUMvision makes sense for a high-traffic site that already has a lab testing tool and wants detailed RUM at a low price per page view.
10. Calibre
Score: 7.2/10
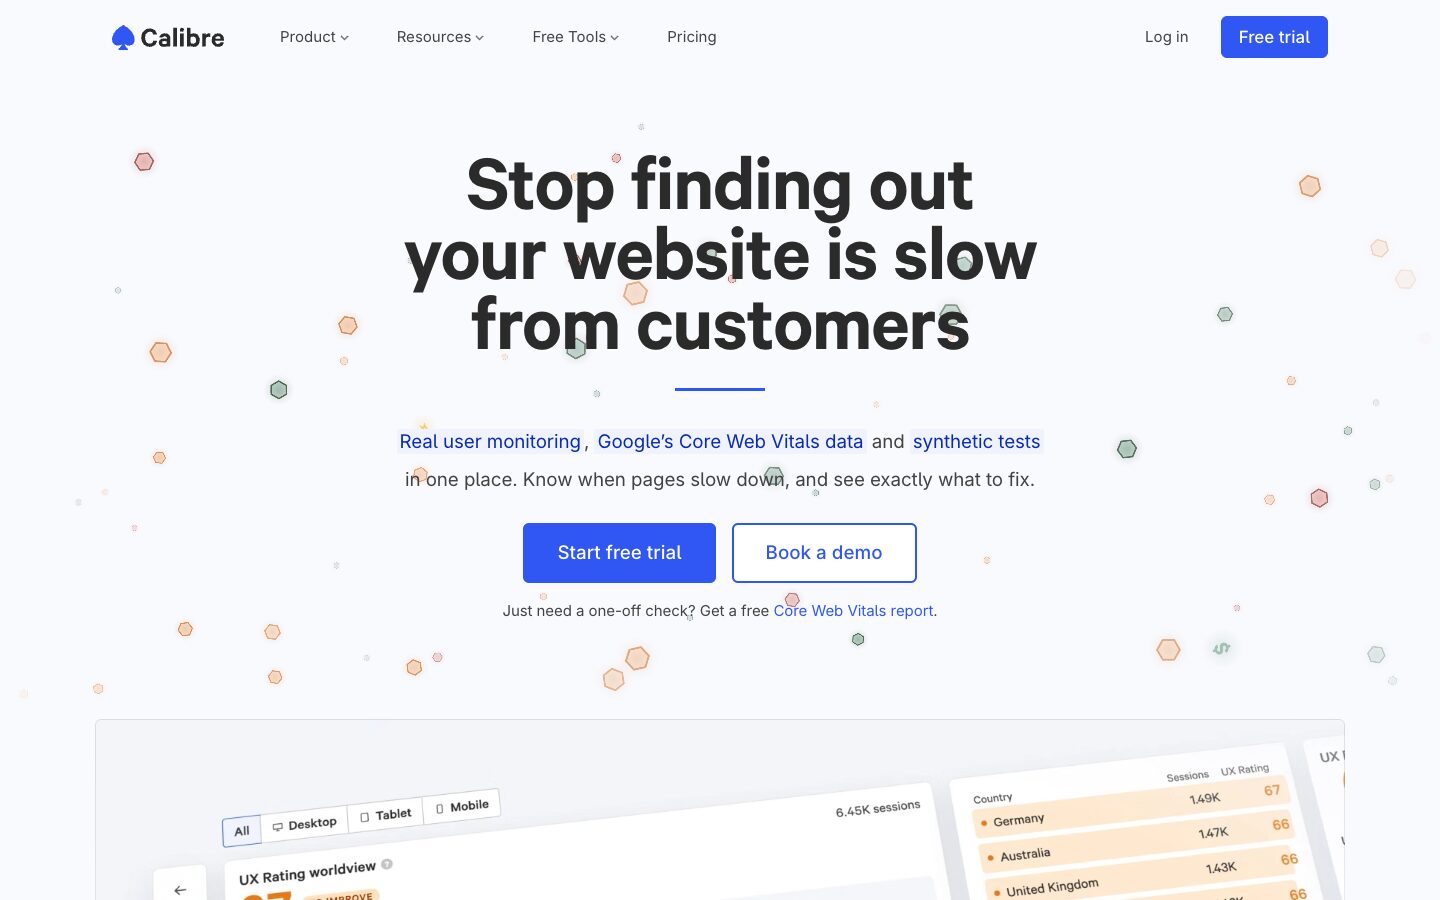
Why it ranks #10: Calibre puts RUM, CrUX data, and synthetic tests in one place, with unlimited sites and URLs on every plan. It ranks last because its RUM quotas are small for the price (5,000 sessions on the $75/month Starter plan), it tests from 17 locations, and it has no free plan.
Calibre runs scheduled synthetic tests from 17 locations, collects RUM sessions, and shows CrUX data next to them, with an automation API and a command-line client. Its free website speed test runs desktop or mobile tests from Sydney, Frankfurt, or North Virginia with no sign-up. There's also a free Core Web Vitals test and a side-by-side speed comparison of up to 5 sites.
Starter costs $75/month for 5,000 RUM sessions, 5,000 synthetic tests, 3 seats, and 90 days of RUM data. Team costs $150/month for 10,000 sessions, 15,000 tests, 10 seats, and a year of RUM data. Company costs $1,500/month, paid yearly, for 1 million sessions and 2 years of RUM data. There's a 15-day free trial.
A session usually includes several page views, but 5,000 sessions for $75/month is still small next to DebugBear's 100,000 page views for $125/month or RUMvision's 1.5 million for €150/month. Most growing sites will need to sample their traffic or move up a plan.
| Pros | Cons |
|---|---|
| ✅ RUM, CrUX, and synthetic tests in one place | ❌ No free plan (15-day trial) |
| ✅ Unlimited sites and URLs | ❌ Only 5,000 RUM sessions on Starter |
| ✅ Automation API and CLI | ❌ 17 test locations |
| ✅ Free speed test and speed comparison | ❌ Big jump from $150 to $1,500/month |
Calibre is a good fit for a small team with many low-traffic sites: every plan allows unlimited sites, and low traffic keeps you inside the RUM quota.
Which Website Speed Testing Tool Should You Use?
Summing up, here's your best choice:
- Want lab tests, TTFB tests, RUM, and monitoring in one place? SpeedVitals. Start on the Free plan.
- Checking one page, or looking for Google's field data? PageSpeed Insights.
- Managing client sites, or testing pages behind a login? DebugBear.
- Want a simple lab tool with cheap monitoring? GTmetrix.
- Need full control of a lab test for free? WebPageTest.
- A large team with performance budgets in CI? SpeedCurve.
- Testing a local or staging build? Lighthouse.
- Already need uptime and transaction monitoring? Uptrends.
- Only want RUM for a high-traffic site? RUMvision.
- Monitoring many small sites with a small team? Calibre.
Whichever tool you pick, test the same page with the same device and location every time, and check the field data before you call a fix done. Once you know what's slow, our guide on website performance optimization ranks the fixes by impact.