Best Real-User Monitoring (RUM) Tools in 2026

Many real-user monitoring (RUM) tools started out catching JavaScript errors, slow API calls, and crashes, and Core Web Vitals arrived later as one more chart. That works for an SRE team. But if your job is getting LCP, INP, and CLS into the green, you need a RUM tool that tells you which element, interaction, or script caused a poor score.
So I've ranked the 10 best real-user monitoring tools for Core Web Vitals and website speed, and scored each one out of 10 with the reason it landed where it did. Observability platforms like Datadog are excellent for error tracking and APM, but here they're judged on Core Web Vitals alone, so they score lower.
SpeedVitals (9.5/10) is the best RUM tool for Core Web Vitals for most website owners, developers, and agencies. RUM comes with every plan, including a Free plan with 5,000 page views a month, and the same account has lab tests and TTFB tests to reproduce what RUM finds. CoreDash (9.2) is the best RUM-only tool, with detailed LCP, INP, and CLS attribution from $20/month, and DebugBear (9.0) is the best pick if you need white-label reports.
SpeedVitals is our own product, so I've listed its cons just as plainly as everyone else's. Here's how the 10 tools compare at a glance (prices from each vendor's pricing page at the time of writing, monthly billing unless noted):
| Rank | Tool | Score | Best For | Free Plan or Trial | Paid RUM From |
|---|---|---|---|---|---|
| 1 | SpeedVitals | 9.5/10 | RUM with attribution plus lab tests, on any budget | ✅ Free plan (5,000 page views) | $19/month |
| 2 | CoreDash | 9.2/10 | Detailed RUM-only attribution at a low price | ❌ 14-day trial | $20/month |
| 3 | DebugBear | 9.0/10 | RUM, lab tests, and white-label reports | ❌ 14-day trial | $125/month |
| 4 | SpeedCurve | 8.6/10 | Large teams with performance budgets | ❌ Demo only | $90/month |
| 5 | RUMvision | 8.4/10 | High-traffic sites that already have a lab tool | ❌ Demo only | €150/month |
| 6 | Request Metrics | 8.0/10 | Small teams that want RUM and weekly Lighthouse tests | ✅ Free plan (1,000 page views) | $37/month |
| 7 | Cloudflare Web Analytics | 7.6/10 | Free Core Web Vitals monitoring | ✅ Completely free | N/A |
| 8 | Datadog | 7.0/10 | Teams already on Datadog | ❌ 14-day trial | $0.15 per 1,000 sessions, plus extras |
| 9 | PostHog | 6.8/10 | Product teams already on PostHog | ✅ 1 million free events/month | Pay as you go |
| 10 | Catchpoint | 6.4/10 | Enterprises already on Catchpoint or LogicMonitor | ❌ | Quote only |
How I Ranked and Scored These RUM Tools
I scored every tool on the same six things:
- Core Web Vitals attribution: whether the tool names the LCP element and splits LCP into its subparts, ties a slow INP to the interaction, its phases, and the scripts behind it, and shows which elements shift for CLS.
- Focus on website speed: whether Core Web Vitals sit at the center of the product, or behind error tracking, APM, and product analytics.
- Lab tests in the same tool: so you can reproduce what RUM finds and check a fix before it reaches visitors.
- Price at your traffic: the free tier first, then what your monthly page views (or sessions) cost.
- History: how many months of RUM data you keep on the plan you'd actually buy.
- Setup and privacy: WordPress and Shopify plugins, single-page app (SPA) support, and whether the script needs cookies.
Attribution and focus carry the most weight. Every tool here reports p75 LCP, INP, and CLS, so I scored them on how quickly a poor number turns into something you can fix.
Our team has used SpeedVitals and DebugBear extensively over the years. For the other eight tools, this is an assessment based on their websites, pricing pages, and documentation. I didn't run any new speed tests or RUM trials for this article.
RUM vs Lab Tests vs CrUX
Performance tools report three kinds of data, and RUM is only one of them:
- Lab tests load your page under fixed conditions (one device, one network, one location). They're repeatable, which makes them the right tool for debugging and for checking a fix.
- CrUX (the Chrome User Experience Report) is Google's field data: the 75th percentile of opted-in Chrome users over a rolling 28-day window. PageSpeed Insights and Search Console show it, and our guide on field data vs origin summary explains how to read it.
- RUM measures visits to your own site through a small script, so it covers pages CrUX has too little data for, and a regression shows up the day you deploy it.
The gap between lab and RUM numbers can be huge. One Redditor saw an LCP of 12 s in Lighthouse and PageSpeed Insights, while the RUM data they collected with Google's web-vitals library sat close to 2.5 s.
They didn't say why, but a mobile Lighthouse run simulates a mid-tier phone on a slow 4G connection from one location. Many real visitors have faster phones, faster networks, or a warm cache. The gap can also go the other way when your visitors are far from your server. So use RUM to decide which pages and metrics need work, and a lab test with a matching device and location to find the cause.
What a Good RUM Tool Shows You
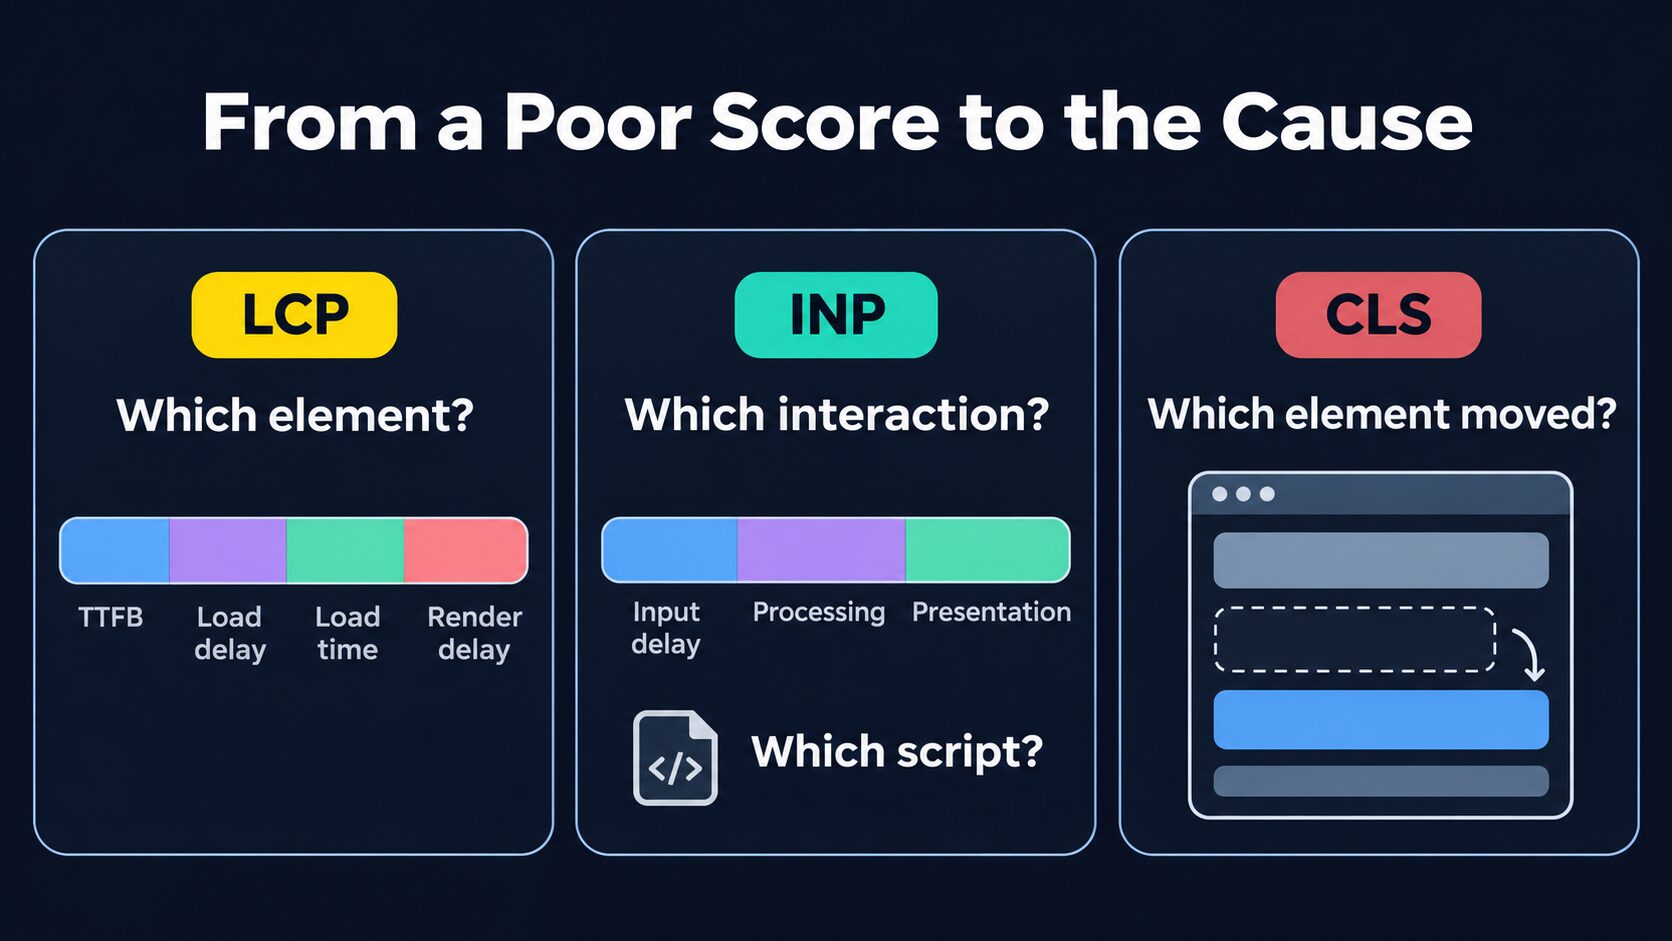
A RUM tool that only reports a p75 tells you that something is slow, but not what. A good one for Core Web Vitals breaks each metric down until it points at something you can change:
- LCP: the LCP element, plus its four subparts: TTFB, resource load delay, resource load duration, and element render delay. A long load delay usually means the browser found the image late, which preloading the LCP image fixes. A long TTFB points to the server or a cache miss.
- INP: the element someone clicked or tapped, the three phases (input delay, processing duration, and presentation delay), and the scripts that ran during the slow frame, which Long Animation Frames (LoAF) data provides.
- CLS: the elements that shifted and when, so you know which image, ad slot, or embed to reserve space for.
The top five tools on this list show most of this breakdown in their dashboards. Datadog does too, but you buy it inside a platform built for errors, traces, and infrastructure. PostHog and Catchpoint collect the metrics but show far less of the breakdown, which is why they sit at the bottom.
1. SpeedVitals
Score: 9.5/10
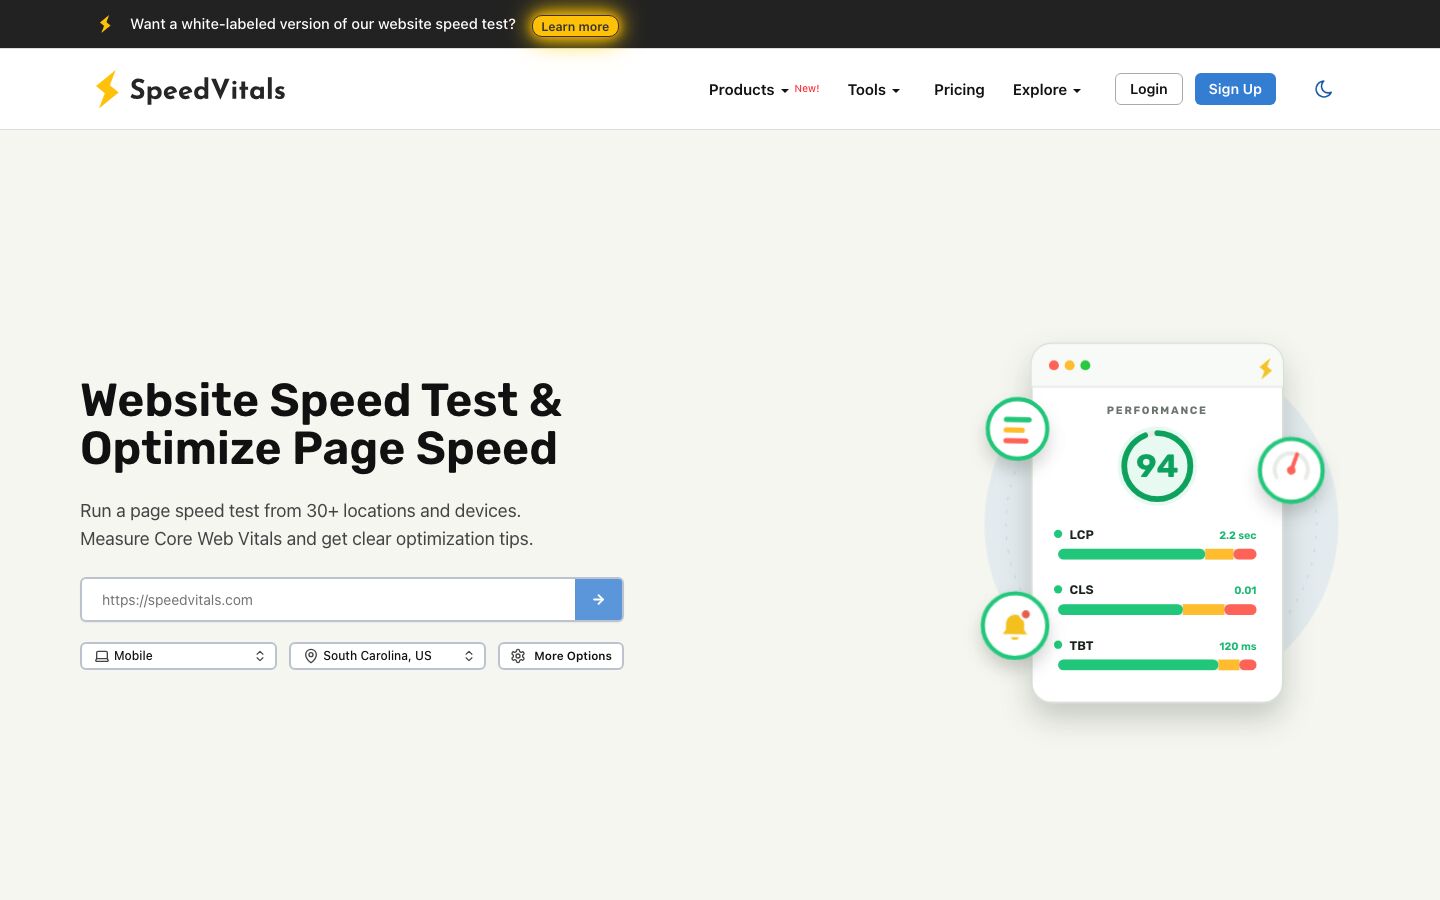
Why it ranks #1: It's the only tool here that pairs a free RUM plan with lab tests, multi-location TTFB tests, and scheduled monitoring in the same account. Its RUM ties poor LCP, INP, and CLS to elements and interactions, and names the third-party scripts behind long animation frames. It loses half a point for the gaps below: no white-label reports, API access only from the $99/month Pro plan, and 3 months of RUM performance data on Free and Starter.
SpeedVitals Real-User Monitoring shows the Core Web Vitals of your actual visitors in real time, without the 28-day delay of CrUX and Search Console.
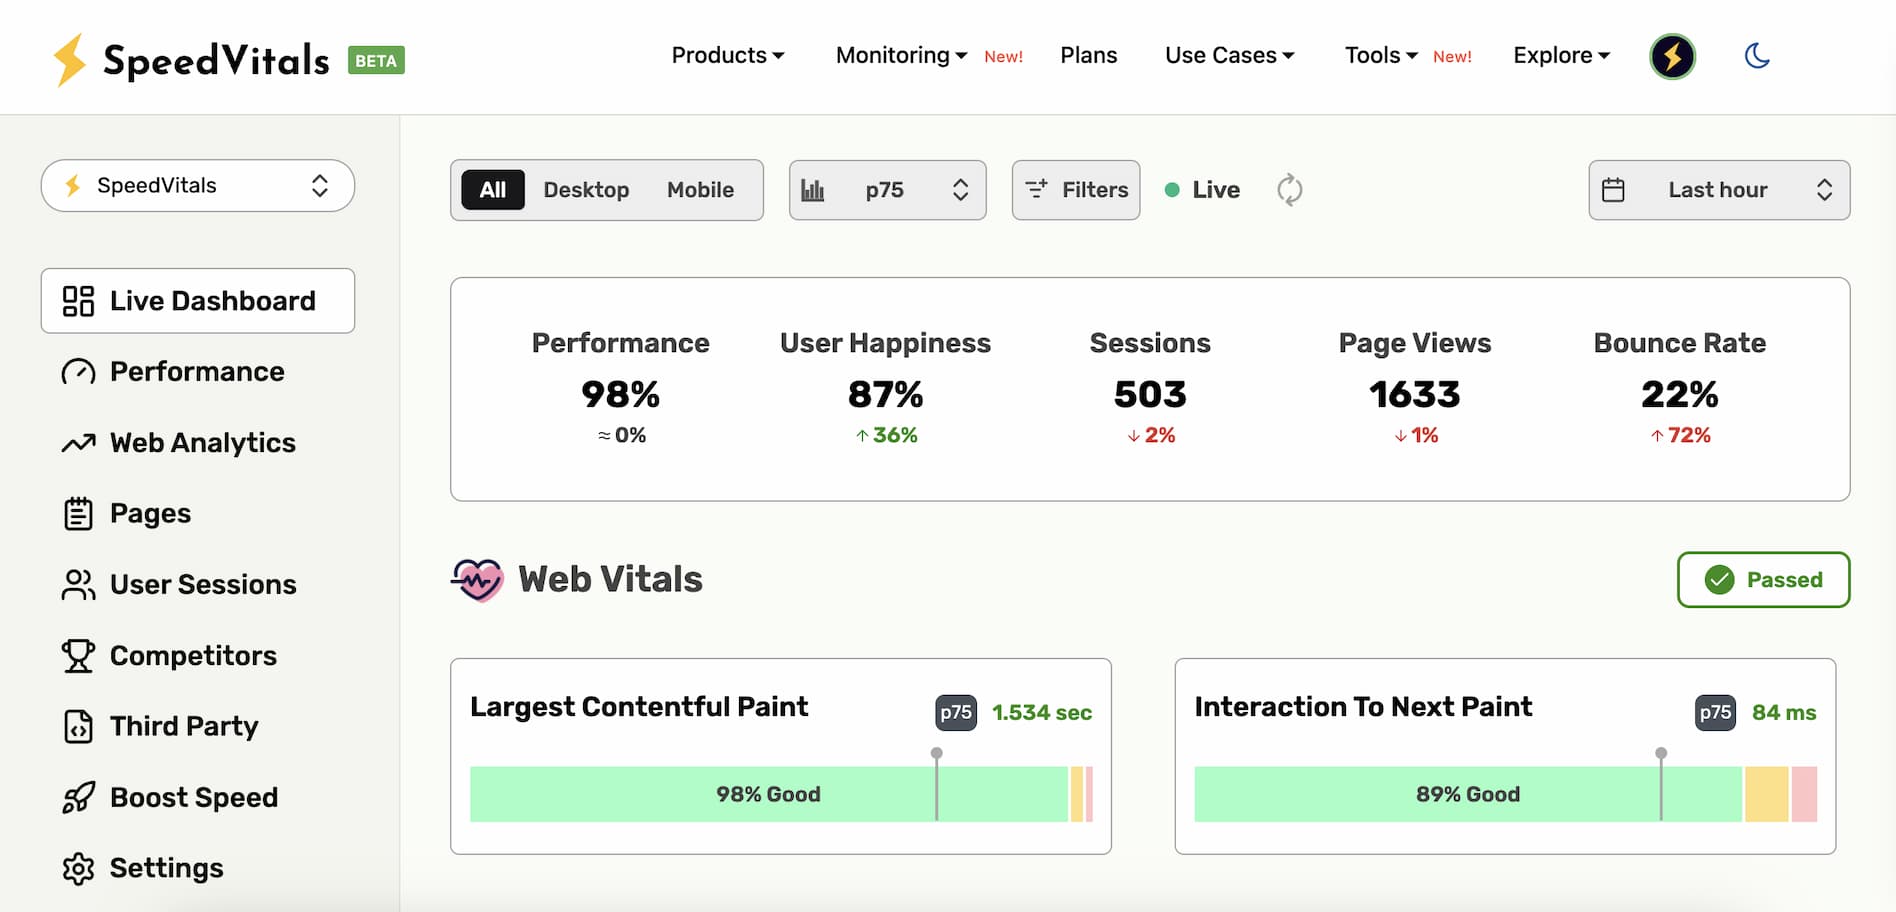
The RUM side includes:
- Live dashboard: p75 LCP, INP, and CLS as visitors arrive.
- Attribution: the elements and interactions behind high LCP, INP, and CLS, with INP split into input delay, processing duration, and presentation delay.
- Third-party scripts: every third-party script with a long load time or long animation frames, plus lighter alternatives where they exist.
- Waterfall for real visits: request-level data for every page view, like the waterfall in our speed test.
- Performance audits: RUM issues ranked by severity (limited on Free and Starter).
- Alerts: RUM alerts, so a Core Web Vitals problem from real visitors reaches you without opening the dashboard.
- Competitors: finds your competitors automatically and ranks your RUM data against their CrUX data.
- Web analytics: a Google Analytics alternative with country, city, and device data, no cookies, and anonymized IP addresses.
- Setup: plugins for WordPress, Shopify, Joomla, and Drupal, plus SPA support for React, Vue, Svelte, and Angular.
In our RUM public beta, the third-party section showed one group of Google scripts causing 1,112 ms of long animation frames, more than four times what Google Analytics caused on the same site. When a low-priority script tops that list, delaying it until user interaction is often the quickest fix. Just never delay a consent manager, a checkout script, or anything needed above the fold.
When RUM flags a slow page, you don't need a second tool to reproduce it. You can run the website speed test in the same account from the device and location your visitors use, with a waterfall, a layout shift visualizer, and code coverage. The TTFB test checks response times from 30 locations on Free and 40+ on paid plans, with cache status. That quickly shows whether a high RUM TTFB comes from a cache miss in one region. Our guide on reducing server response time covers the fixes from there.
Here are the SpeedVitals plans and their RUM limits:
| SpeedVitals Plan | Monthly Price | RUM Page Views per Month | RUM Websites | RUM Performance Data | Speed + TTFB Tests per Week |
|---|---|---|---|---|---|
| Free | $0 | 5,000 | 1 | 3 months | 15 + 15 |
| Starter | $19 | 5,000 | 1 | 3 months | 300 + 300 |
| Growth | $49 | 20,000 | 3 | 1 year | 750 + 750 |
| Pro | $99 | 200,000 | 10 | 2 years | 1,500 + 1,500 |
| Ultimate | $399 | 1,000,000 | Unlimited | 2 years | 3,500 + 3,500 |
Web analytics data is kept longer than performance data: 1 year on Free and Starter, 2 years on Growth, and 5 years on Pro and Ultimate. Yearly billing gives you two months free, and you can buy extra page views as an add-on. Speed test locations go from 10 on Free and Starter to 35 on Growth and above.
Now the cons. SpeedVitals has no white-label reports, API access starts on Pro, and Free and Starter keep only 3 months of RUM performance data. At a million page views a month or more, it also costs more per page view than CoreDash or RUMvision.
| Pros | Cons |
|---|---|
| ✅ RUM on every plan, including Free | ❌ No white-label reports |
| ✅ LCP, INP, and CLS attribution | ❌ API access only on Pro and above |
| ✅ Third-party script breakdown with alternatives | ❌ 3 months of RUM performance data on Free and Starter |
| ✅ Request waterfall for real page views | ❌ Costs more per page view at 1 million+ page views |
| ✅ Lab tests, TTFB tests, and monitoring in the same plan | |
| ✅ Competitor CrUX comparison | |
| ✅ RUM alerts | |
| ✅ Built-in web analytics, no cookies | |
| ✅ Plugins for WordPress, Shopify, Joomla, and Drupal | |
| ✅ 10 websites on Pro with no per-domain fee |
If you want RUM that tells you what to fix, plus the lab tools to fix it, SpeedVitals is the one I'll highly recommend. Start on the Free plan, add the RUM script (or the WordPress or Shopify plugin), and let a couple of weeks of traffic build up before you trust the p75 numbers.
2. CoreDash
Score: 9.2/10
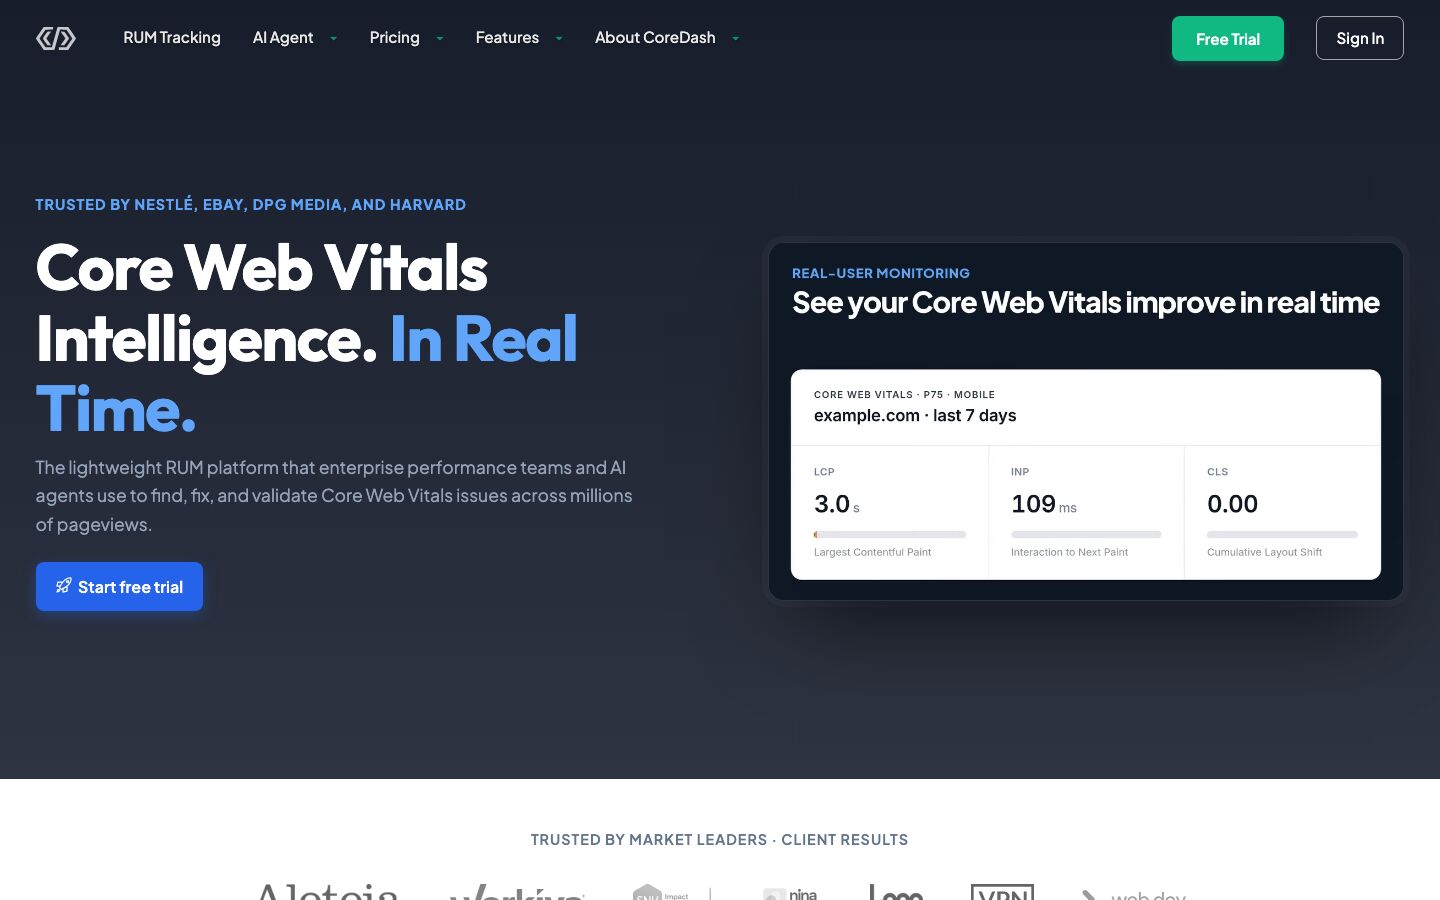
Why it ranks #2: CoreDash is built for one job, Core Web Vitals RUM. Its attribution is as detailed as anything on this list: LCP phases, INP phases, the script behind each slow interaction, and the elements that shift. It also starts at $20/month. It ranks below SpeedVitals because it has no free plan and its pricing page lists no lab tests. So you'll want a second tool to reproduce what it finds.
CoreDash is a lightweight RUM tool based in the Netherlands, built on Google's web-vitals library, with a script under 2 KB. It measures LCP, INP, CLS, TTFB, and FCP on every page view.
For LCP, it shows the element, its type, the image URL and priority, and all four LCP phases. INP gets the three phases, the input type, the load state, and the Long Animation Frame script behind it, while CLS gets the shifting element, the cause, and the timing. Slow page views also get a resource waterfall, and SPAs are covered through soft navigations.
It also cross-references your data with CrUX, sends email and Slack alerts, and has an MCP server, a JSON-RPC API, and a WordPress plugin. Data is hosted in the EU, with no cookies or personal data.
| CoreDash Plan | Monthly Price | Annual (per Month) | Page Views per Month | Sites | Data Retention |
|---|---|---|---|---|---|
| Starter | $20 | $16 | 75,000 | 1 | 6 months |
| Standard | $39 | $31 | 500,000 | 2 | 1 year |
| Studio | $89 | $71 | 1 million (shared) | 10 | 3 years |
| Enterprise | $399 | $319 | 3.5 million+ | Custom | 8 years |
There's a 14-day free trial with no card required. At 200,000 page views a month, CoreDash costs $39 against $99 on SpeedVitals Pro, and at 1 million it costs $89 against $399 on SpeedVitals Ultimate. Those SpeedVitals plans include lab tests, TTFB tests, and monitoring, though, which CoreDash's plans don't list.
One thing to check before you rely on it: the homepage says CoreDash doesn't sample, while the pricing page says sample-rate auto-tuning keeps the bill predictable. Ask which applies to your plan if you need every page view counted.
| Pros | Cons |
|---|---|
| ✅ LCP and INP phases, LoAF scripts, and CLS sources | ❌ No free plan |
| ✅ RUM from $20/month | ❌ No lab tests in its plans |
| ✅ 1 million page views and 10 sites for $89/month | ❌ 6 months of data on Starter |
| ✅ Script under 2 KB | ❌ Studio's page views are shared across all sites |
| ✅ EU hosting, no cookies | ❌ No session replay |
| ✅ MCP server, API, and WordPress plugin |
CoreDash is the better choice if you only want RUM with detailed attribution, for as little as $20/month.
3. DebugBear
Score: 9.0/10
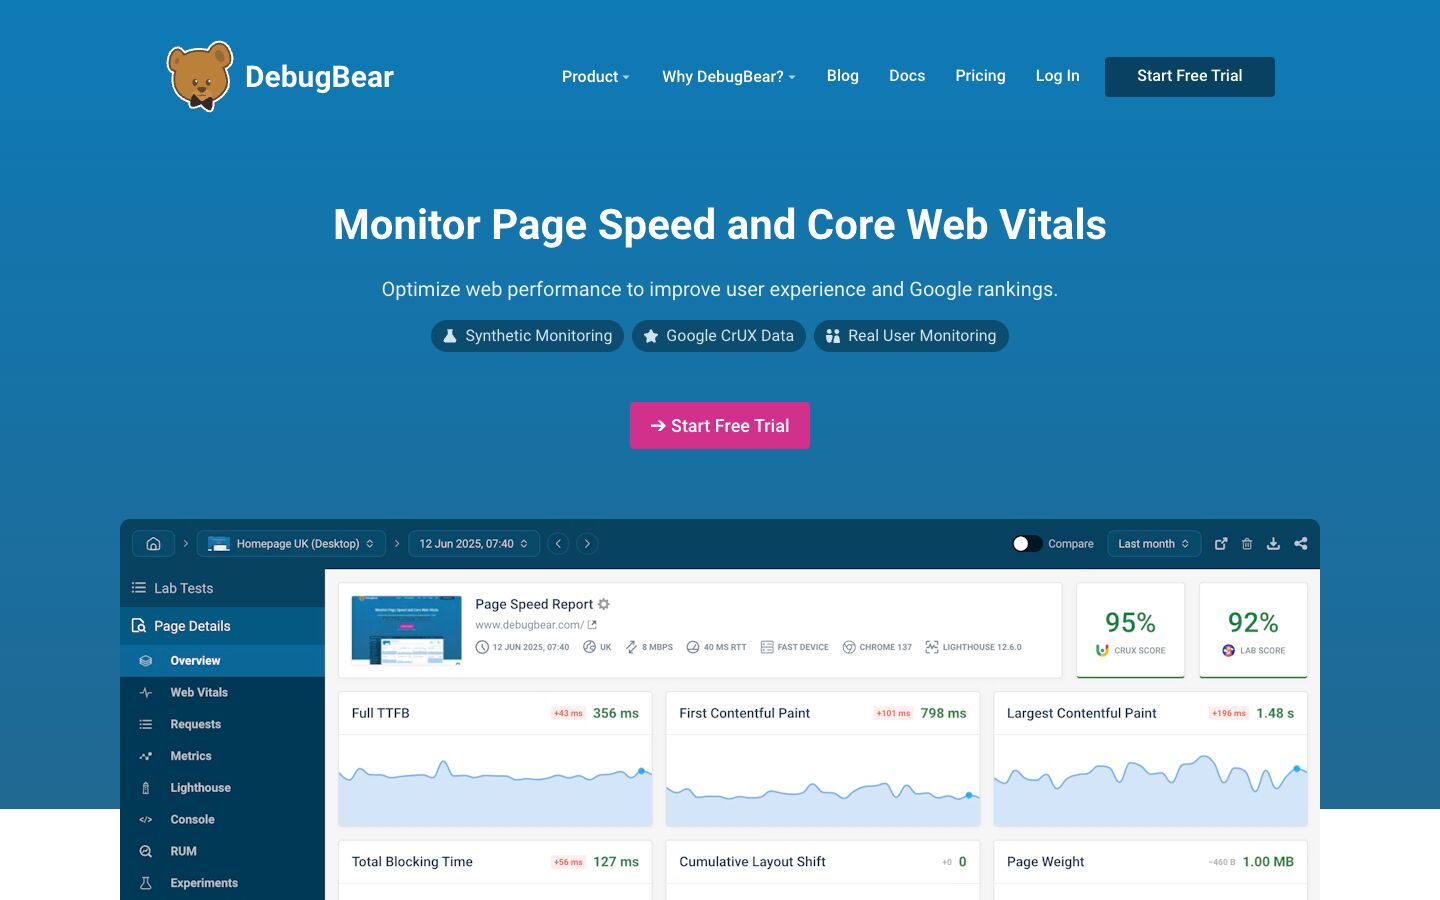
Why it ranks #3: DebugBear is still my second favorite performance tool after SpeedVitals. It's also the most complete paid option here: RUM with LCP subparts and INP script attribution, plus lab tests, CrUX data, user flows, and white-label reports in one plan. It ranks below CoreDash because there's no free plan, and RUM starts at $125/month, more than six times CoreDash's entry price.
DebugBear's RUM splits LCP into TTFB, resource load delay, load time, and render delay, and INP into input delay, processing time, and presentation delay. For each, it records the element's selector, and for INP it also names the primary script, function, and invoker behind the interaction, based on Long Animation Frames. TTFB gets its own breakdown into DNS, TCP, SSL, and the rest of the connection.
You can slice the data by device, browser, country, network type, navigation type, page group, UTM campaign, and up to 5 custom tags. RUM budgets alert you by email, Slack, or Microsoft Teams, and an SPA mode tracks every soft navigation as its own page view. The script is about 20 KB compressed and uses no cookies by default.
Around the RUM, DebugBear adds lab tests on a real throttled connection, login and user flow tests, uptime monitors, and page speed experiments. You also get white-label exports, a Looker Studio integration, and an MCP server (added in June 2026) that can query RUM data.
| DebugBear Plan | Monthly Price | RUM Page Views per Month | Synthetic Tests per Month |
|---|---|---|---|
| Intro | $69 | Add-on: $75 per 500,000 | 350 |
| Startup | $125 | 100,000 | 4,000 |
| Team | $325 | 500,000 | 10,000 |
| Corporate / Agency | $899 | 2 million | 50,000 |
Yearly billing saves 20% (Startup drops to $99/month). Every plan keeps 24 months of data and allows unlimited domains, and there's a 14-day free trial with no card. The Intro plus RUM route costs $144/month for 500,000 page views, but Intro has only one user. Our list of DebugBear alternatives compares its plans in more detail.
| Pros | Cons |
|---|---|
| ✅ LCP subparts and INP script attribution | ❌ No free plan (14-day trial) |
| ✅ RUM, lab tests, and CrUX in one tool | ❌ RUM starts at $125/month |
| ✅ RUM budgets and alerts | ❌ No WordPress or Shopify plugin |
| ✅ Login and user flow testing | ❌ About 20 KB RUM script |
| ✅ White-label exports and Looker Studio | |
| ✅ 24 months of data and unlimited domains |
Pick DebugBear if you manage client sites that need white-label reports, or if your RUM needs to sit next to lab tests of pages behind a login.
4. SpeedCurve
Score: 8.6/10
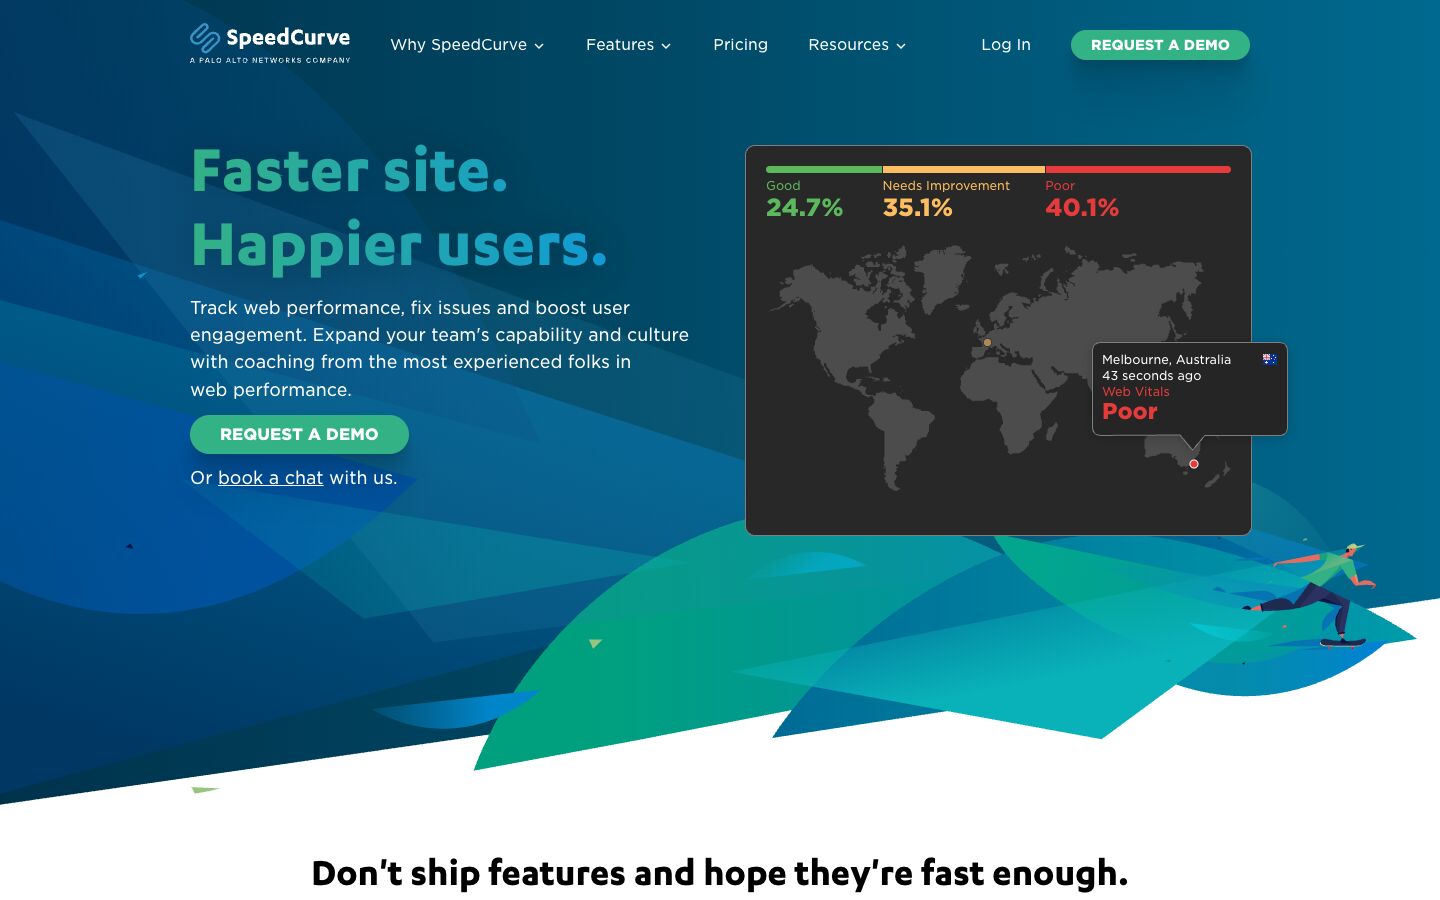
Why it ranks #4: SpeedCurve pairs RUM (with INP script attribution and LCP subparts) with synthetic tests, performance budgets, and CI/CD integration, and every plan includes unlimited users. It ranks below DebugBear because there's no free plan or trial (only a demo), the minimum is $90/month, and plans under $500/month show only 3 months of RUM history.
SpeedCurve's RUM, built on its own lux.js script, shows LCP in four subparts and INP in three, and lets you segment by the LCP element, the viewport, or the interaction target. There's an INP-by-selector heatmap and a table of scripts that ran during slow interactions. One limit: the LCP subparts only appear when the LCP element is an image or video, so a text LCP shows no breakdown.
It's built for teams that run a performance process: RUM and synthetic budgets with alerts by email, Slack, Microsoft Teams, or webhook, CI/CD integration through its API, competitor benchmarking, and filters for page labels, device, browser, region, connection, and soft navigations. It also has an official Shopify app. The script sets a session cookie, which you can delay until consent.
You build a plan from RUM page views and synthetic checks. Starter begins at $90/month and Growth at $576/month, which adds 13 months of RUM history and priority support. On its calculator, 2 million RUM page views cost $270/month ($135 per million), with 20% off for annual billing. Below $500/month, though, you can only see the last 3 months of RUM data.
SpeedCurve has also changed owners twice in under a year. Embrace acquired it in November 2025, and Palo Alto Networks completed its acquisition of Embrace in August 2026. Our list of SpeedCurve alternatives covers what that means for existing customers.
| Pros | Cons |
|---|---|
| ✅ RUM and synthetic monitoring in one tool | ❌ No free plan or trial |
| ✅ INP scripts, selector heatmap, and LCP subparts | ❌ $90/month minimum |
| ✅ Performance budgets and CI/CD integration | ❌ 3 months of RUM history under $500/month |
| ✅ Unlimited users and teams | ❌ No LCP subparts for text elements |
| ✅ $135 per million RUM page views | ❌ Two ownership changes in under a year |
| ✅ Official Shopify app |
SpeedCurve fits a large team with high traffic and a performance budget process wired into its deploys.
5. RUMvision
Score: 8.4/10
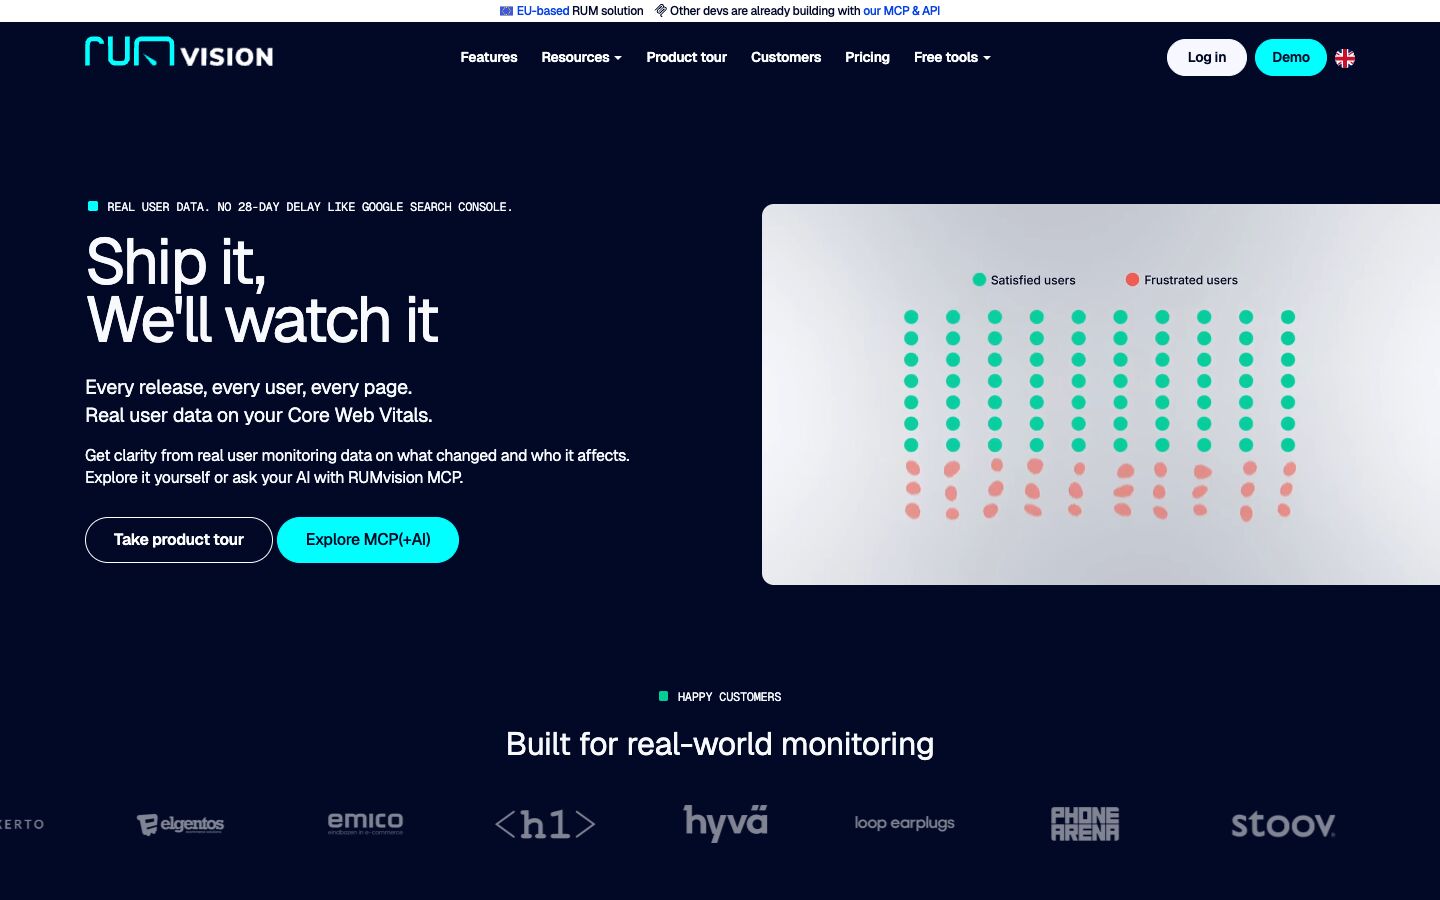
Why it ranks #5: RUMvision is built only for Core Web Vitals RUM, with element and script attribution, daily regression alerts, weekly reports, and a CrUX comparison with up to 10 competitors. Its €150/month Growth plan covers 1.5 million page views. It ranks below SpeedCurve because it has no lab tests, no free plan or trial, and every subdomain counts as a separate domain.
RUMvision is a RUM-only tool from the Netherlands, with data stored in the EU. Its element filter shows the LCP element, the INP target, and the CLS element. For the highest INP, it tracks the longest script by hostname, script, function, and invoker type using Long Animation Frames (in Chrome and Edge 123 and later). It also rates your first-party and third-party scripts by their impact. The TTFB, FCP, LCP, and INP breakdowns need its metric debugging option turned on.
You can segment by 45+ dimensions, including device model, country, CDN location, connection, page template, and navigation type, and templates are set up automatically for Shopify and Magento 2 stores. Alerts go to email, Slack, Microsoft Teams, Discord, or Zapier, and since October 2026, AI analysis of alerts and health checks is live for every domain. There's also a read-only MCP server and an API, plus SPA guides for Next.js, Nuxt, and other frameworks.
| RUMvision Plan | Monthly Price | Annual (per Month) | Page Views per Month | Domains | Data Retention |
|---|---|---|---|---|---|
| Growth | €150 | €135 | 1.5 million | 2 | Not listed |
| Scale | €700 | €630 | 7.5 million | Up to 5 | 13 months |
Prices exclude VAT. Extra page views cost €75/month per million when you buy them up front, autoscaling costs €25 more than that, and without autoscaling, tracking stops at your monthly limit. Each extra domain costs €20/month, and staging and checkout subdomains count too. The pricing page lists no free plan or trial, only a free 30-minute demo.
For a store with millions of page views, €100 per million is cheap. But a site with 30,000 monthly page views pays the same €150/month, and an agency with 10 client sites on Growth pays for 8 extra domains on top.
| Pros | Cons |
|---|---|
| ✅ 1.5 million page views on the entry plan | ❌ No lab or synthetic tests |
| ✅ LoAF script attribution for INP | ❌ No free plan or trial |
| ✅ Daily regression alerts and weekly reports | ❌ €150/month is steep for small sites |
| ✅ 45+ segments, auto templates for Shopify and Magento | ❌ Every subdomain counts as a separate domain |
| ✅ Competitor CrUX comparison | ❌ Breakdowns need metric debugging turned on |
| ✅ MCP server and API |
RUMvision makes sense for a high-traffic store that already pays for a lab testing tool. Our list of RUMvision alternatives covers what each option costs at different traffic levels.
6. Request Metrics
Score: 8.0/10
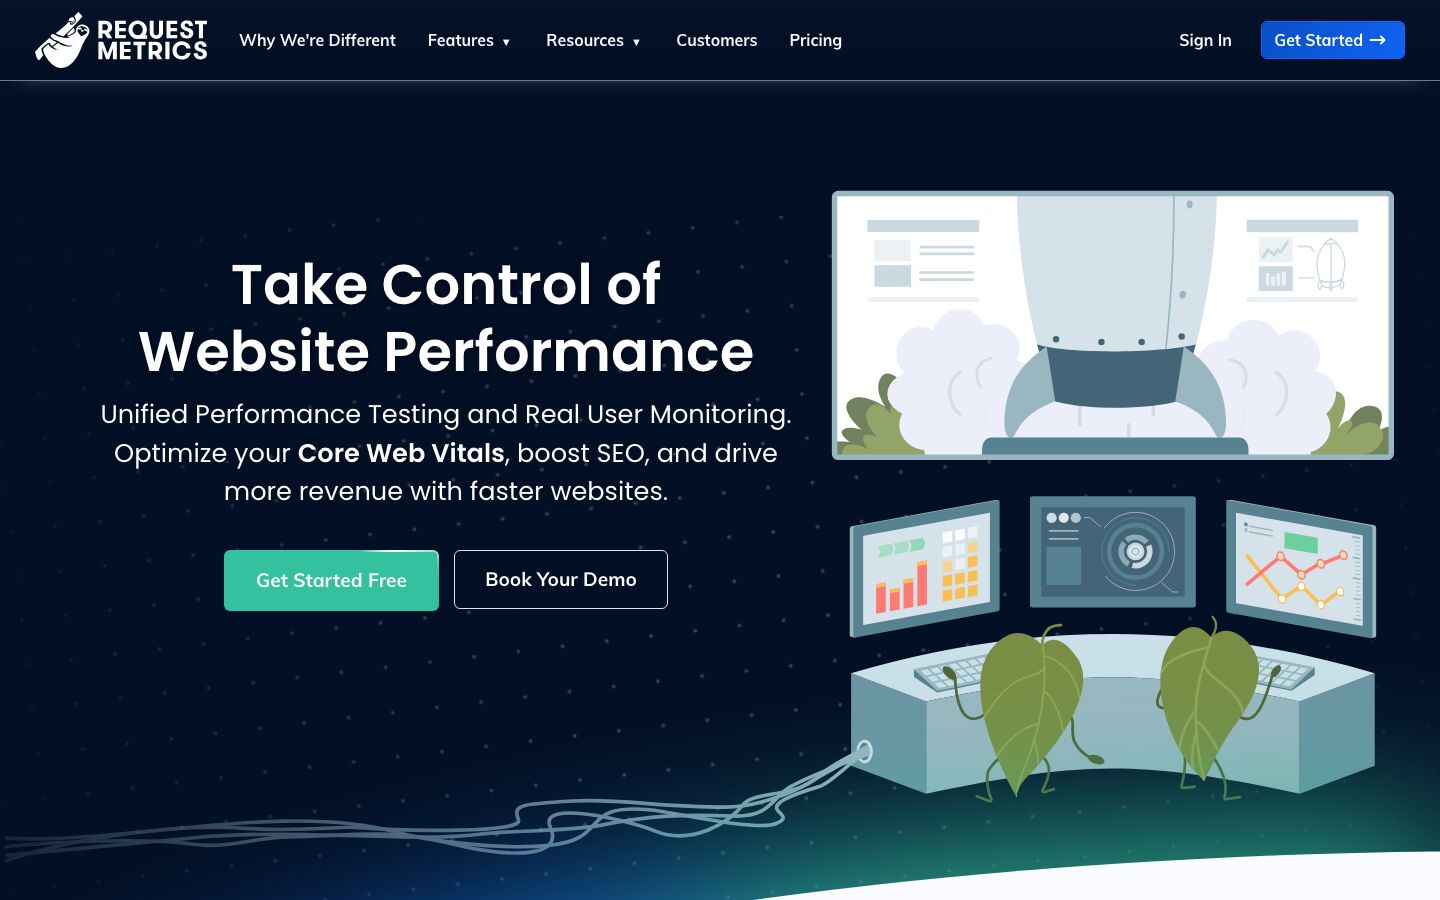
Why it ranks #6: Request Metrics combines RUM with weekly Lighthouse tests, names the LCP element and the elements behind layout shifts, and ties long animation frames to scripts. It has a free plan and paid plans from $37/month. It ranks below RUMvision because the free plan covers only 1,000 page views with 24 hours of data, paid plans keep 30 or 90 days, and its docs don't show an INP phase breakdown.
Request Metrics is made by TrackJS LLC, the company behind the TrackJS error monitoring tool. It measures LCP, INP, CLS, FCP, and TTFB from your visitors. For LCP, it shows the element as a CSS selector, the LCP resource URL, and a timeline for each page view. For CLS, it shows which elements shift and which assets cause the movement, and its Long Animation Frames view ties slow frames to scripts, with inline script snippets and a waterfall.
On top of RUM, it runs Lighthouse tests of your top pages on desktop and mobile every week, compares your CrUX data with competitor origins (Essentials and up), and sends email performance notifications. There's an open-source WordPress plugin. Shopify is a manual theme install for now (its app is in beta), and checkout pages can't be monitored. It uses no cookies, stores no IP addresses, and keeps its data in Canada.
| Request Metrics Plan | Monthly Price | Annual (per Month) | Page Views per Month | Sites | Data Retention |
|---|---|---|---|---|---|
| Free | $0 | N/A | 1,000 | 1 | 24 hours |
| Essentials | $37 | $34 | 75,000 | 3+ | 30 days |
| Professional | $96 | $88 | 500,000 | 10+ | 90 days |
Paid plans can add traffic in blocks, Professional adds performance budgets, and there's a 14-day trial with Professional features. Traffic is also capped per minute, so page views above the cap may be left out during a spike.
Retention is its biggest limit. With 30 or 90 days of data, you can't compare this month's INP with the same month last year, or check whether a fix from last quarter held.
| Pros | Cons |
|---|---|
| ✅ RUM plus weekly Lighthouse tests | ❌ 1,000 page views and 24 hours of data on Free |
| ✅ LCP element and CLS element attribution | ❌ 30 days of data on Essentials, 90 on Professional |
| ✅ Long Animation Frames with script attribution | ❌ No INP phase breakdown in its docs |
| ✅ Competitor CrUX comparison | ❌ Shopify app in beta, no checkout monitoring |
| ✅ No cookies or stored IP addresses | |
| ✅ Paid plans from $37/month |
Request Metrics fits a small team that wants RUM and basic lab tests in one cheap tool, and doesn't need a long history.
7. Cloudflare Web Analytics

Score: 7.6/10
Why it ranks #7: It's free and needs no code on sites proxied through Cloudflare. Its Debug View points to the top elements behind poor LCP, INP, and CLS, with LCP subparts and INP phases. It ranks below Request Metrics because raw data stays unsampled for only 7 days, you can't look back more than 6 months, and it doesn't tie slow interactions to scripts.
Cloudflare Web Analytics is Cloudflare's free, privacy-first analytics, and you don't need Cloudflare's DNS or proxy to use it. Its beacon uses Google's web-vitals library to collect LCP, INP, CLS, FCP, and TTFB, without cookies, local storage, or fingerprinting.
The Core Web Vitals page splits LCP into TTFB, resource load delay, resource load duration, and element render delay, and INP into input delay, processing duration, and presentation delay. Its Debug View lists the top five elements hurting each metric with their CSS selectors and p75 values (p50, p90, and p99 on expand), plus the LCP resource URL and size.
Setup is a toggle for sites proxied through Cloudflare and a JavaScript snippet for the rest, with a limit of 10 sites that aren't proxied. SPAs send metrics on each route change, though Cloudflare says the last one may be lost. Cloudflare also has Observatory, a beta speed tool in the dashboard that runs Lighthouse tests from 21 regions within a monthly quota (50 one-off tests on the Pro plan).
Cloudflare keeps raw beacon data unsampled for 7 days, then aggregates it down to around 10%, and dashboard queries are sampled too. With 6 months of history, you also can't compare one season with the same one a year earlier. And since there's no script attribution, a poor INP points you to an element but not to the third-party script behind it.
| Pros | Cons |
|---|---|
| ✅ Free | ❌ Unsampled data for only 7 days |
| ✅ LCP subparts and INP phases | ❌ 6 months of history |
| ✅ Top 5 elements per metric with CSS selectors | ❌ No script attribution |
| ✅ No cookies or local storage | ❌ 10-site limit when not proxied |
| ✅ No-code setup on proxied sites |
It's the best free starting point on this list, and a quick way to find out whether you have a Core Web Vitals problem worth paying a RUM tool to fix.
8. Datadog
Score: 7.0/10
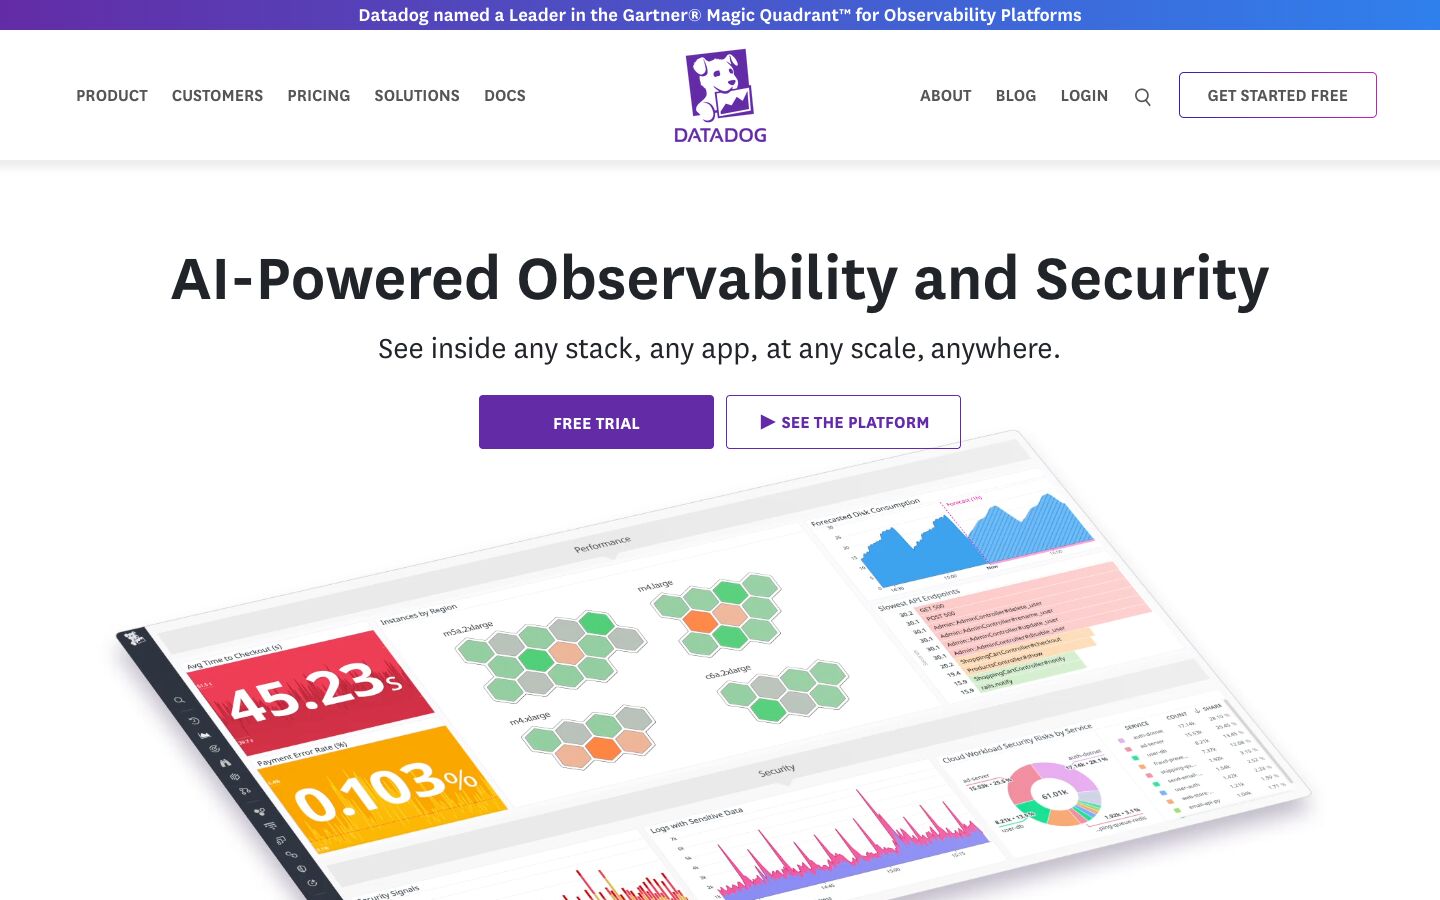
Why it ranks #8: Datadog RUM collects detailed Core Web Vitals data: LCP subparts, INP phases, Long Animation Frames, and target selectors for all three metrics. But it's one product inside an observability platform built for errors, traces, and infrastructure, and you pay for it per session across several SKUs. It ranks below Cloudflare because its main debugging view needs paid Session Replay, vitals events are kept for only 15 days, and LCP isn't reported on SPA route changes.
Datadog's Browser RUM measures LCP and FCP on the initial page view, and INP and CLS on every view, including SPA route changes. Recent versions of its SDK add LCP subparts, INP phases, and Long Animation Frames, along with target selectors for LCP, INP, and CLS and resource timings for every request. You can set monitors on Core Web Vitals, such as p75 INP by view, and its MCP server lets AI tools query RUM events.
The Optimization page puts the subparts, an event waterfall, percentiles, and browser profiling together. But it needs Session Replay running on at least some sessions, which is a paid add-on.
Pricing is per 1,000 sessions a month, split into separate SKUs:
| Datadog RUM SKU (per 1,000 Sessions) | Annual | Month-to-Month | On-Demand |
|---|---|---|---|
| RUM Measure (all sessions) | $0.15 | $0.18 | $0.22 |
| RUM Investigate (sessions you keep) | $3.00 | $3.60 | $4.50 |
| Session Replay add-on | $2.50 | $3.00 | $3.60 |
A session ends after 15 minutes of inactivity, and synthetic browser tests are a separate SKU ($12 per 1,000 runs on annual billing). As an example, 300,000 sessions a month with 10% kept for investigation comes to 300 × $0.15 + 30 × $3 = $135/month at annual list prices, before Session Replay or any synthetic tests.
Retention is the other problem for Core Web Vitals work. Datadog keeps session, view, and error events for 30 days, and resource, long task, and vitals events for 15 days. That's short when you want to compare this month's INP with the last few months.
| Pros | Cons |
|---|---|
| ✅ LCP subparts, INP phases, and LoAF | ❌ Built for observability, not Core Web Vitals |
| ✅ Target selectors for LCP, INP, and CLS | ❌ Optimization view needs paid Session Replay |
| ✅ Monitors on Core Web Vitals | ❌ Vitals events kept for 15 days |
| ✅ Cheap to measure every session | ❌ Several SKUs to budget for |
| ✅ Same platform as your APM and logs | ❌ No LCP on SPA route changes |
If your team already runs Datadog, turning on RUM is the easy choice, and its Core Web Vitals data is better than its rank here suggests. I wouldn't pick Datadog just for Core Web Vitals, though.
9. PostHog
Score: 6.8/10
Why it ranks #9: PostHog's Web Analytics has a Web Vitals tab with LCP, INP, CLS, and FCP, and web vitals events come out of a free tier of 1 million events a month. It ranks below Datadog because the dashboard shows no element or script attribution and no TTFB, and soft navigation support for SPAs is still a preview.
PostHog is an open-source product analytics suite that also does session replay and error tracking, and Web Analytics comes with Product Analytics at no extra cost. Its Web Vitals tab shows trends for FCP, LCP, INP, and CLS at p75, p90, or p99 (PostHog recommends p90), plus a per-page table of good, needs improvement, and poor. It's built on Google's web-vitals library and has its own toggle, so you don't need autocapture or session replay.
Web vitals events are billed as regular events. The first 1 million events a month are free, but that allowance is shared with page views and every other event you send. PostHog says web vitals run at about 30% of your page view volume. After that, events start at $0.00005 each ($50 per million) and get cheaper with volume, with no seat fees. EU hosting and a cookieless mode are available.
Before you trust its numbers, check whose visits they include. One person building an embedded Shopify app forwarded its web vitals to PostHog and found 45 LCP events in one day, while Shopify Admin showed 12 page loads with an LCP. Most of the PostHog events came from their own development stores, and only 3 came from real users. Whichever tool you use, exclude staging, development, and internal traffic before you trust its p75.
| Pros | Cons |
|---|---|
| ✅ 1 million free events a month | ❌ No element or script attribution in the dashboard |
| ✅ p75, p90, and p99 views | ❌ No TTFB in the Web Vitals tab |
| ✅ Web vitals next to product analytics and replays | ❌ SPA soft navigations still in preview |
| ✅ EU hosting and a cookieless mode | ❌ No lab tests or CrUX data |
If your team already uses PostHog, switch on web vitals and you'll get a free trend line for every page. When a page turns poor, though, you'll need another tool to find out why.
10. Catchpoint

Score: 6.4/10
Why it ranks #10: Catchpoint is an enterprise internet performance monitoring platform with RUM, synthetic tests, and WebPageTest under one roof. But for Core Web Vitals, its RUM documents attribution only for INP, doesn't chart Core Web Vitals for SPA soft navigations, and is priced by quote only, while the product moves into LogicMonitor.
LogicMonitor announced its acquisition of Catchpoint in December 2025, and Catchpoint's RUM page now redirects to LogicMonitor's. Catchpoint also owns WebPageTest, which it bought in 2020.
Its RUM collects LCP, INP, CLS, FCP, and TTFB, along with navigation timings, visually complete, and rage, dead, and error clicks. For INP, it lists the top 10 elements causing an INP above 200 ms. You also get per-session waterfalls, RUM alerts by email or webhook, CDN benchmarks built from your own RUM traffic, an MCP server, and a REST API. Session replay is an add-on that your account manager enables.
Trend data is kept for 1 or 3 years depending on your contract, and waterfalls for 60 or 100 days. The tag is about 12 KB inline plus about 32 KB loaded asynchronously, far more than the under-2 KB script CoreDash advertises. LogicMonitor lists RUM with Session Replay as an add-on with no public price.
| Pros | Cons |
|---|---|
| ✅ RUM, synthetic tests, and WebPageTest from one vendor | ❌ Quote-only pricing |
| ✅ Top 10 elements behind a poor INP | ❌ No documented LCP or CLS attribution |
| ✅ 1 to 3 years of trend data | ❌ No Core Web Vitals on SPA soft navigations |
| ✅ CDN benchmarks from your own RUM traffic | ❌ About 44 KB of RUM script |
| ❌ Mid-integration into LogicMonitor |
Catchpoint makes sense for a large company that already uses it to monitor CDNs, DNS, and internet performance. For Core Web Vitals alone, every other tool on this list is easier to start with.
Which RUM Tool Should You Use?
Summing up, here's your best choice:
- Want RUM with attribution plus lab tests, starting free? SpeedVitals.
- Only want RUM, with detailed attribution at a low price? CoreDash.
- Need white-label reports, user flows, and RUM in one tool? DebugBear.
- A large team with performance budgets in CI? SpeedCurve.
- Millions of page views a month and a lab tool already? RUMvision.
- A small team that wants RUM and weekly Lighthouse tests? Request Metrics.
- No budget at all? Cloudflare Web Analytics.
- Already running Datadog? Turn on Datadog RUM.
- Already using PostHog for product analytics? Switch on its web vitals.
- An enterprise already on Catchpoint or LogicMonitor? Catchpoint.
Whichever tool you pick, check mobile and desktop separately, since a good overall p75 can hide one failing page type on phones. Once RUM shows you which pages and metrics fail, our guide on website performance optimization ranks the fixes by impact, and our list of the best website speed testing tools covers the lab side.